A
 `
`B
C
D
Text Solution
Verified by Experts
The correct Answer is:


Topper's Solved these Questions
Similar Questions
Explore conceptually related problems
CBSE COMPLEMENTARY MATERIAL-STATISTICS-PRACTICE TEST
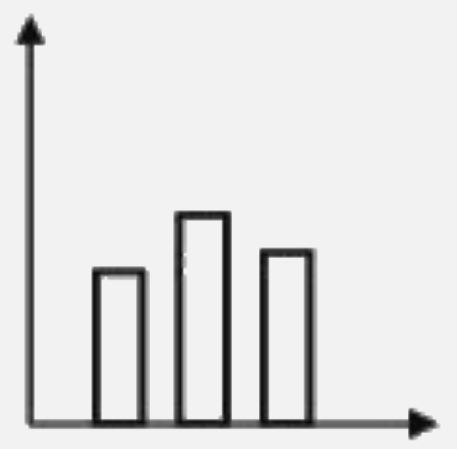
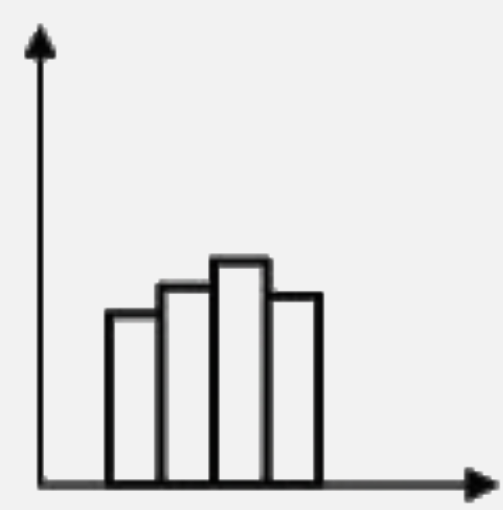
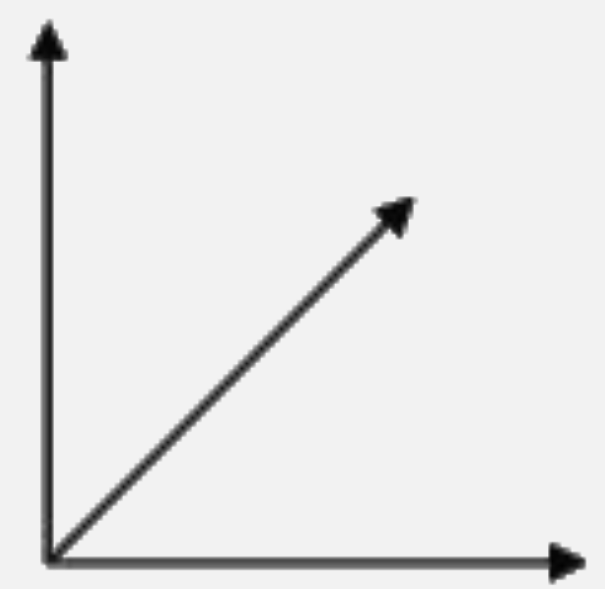
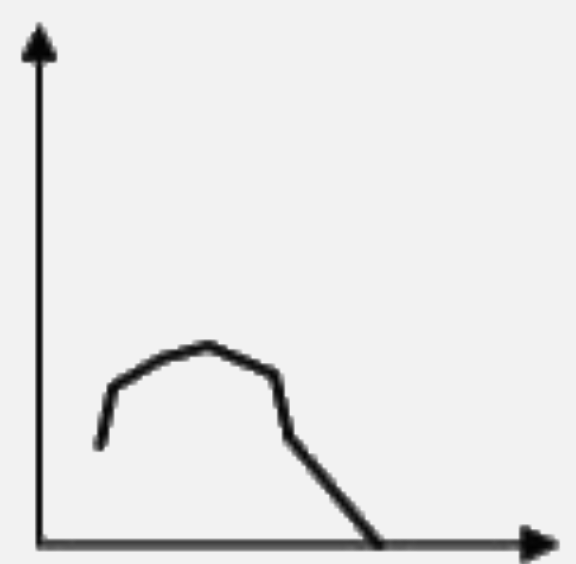
- Which of the figures represent a histogram correctly-
Text Solution
|
- Write class size and class limits of the following: 47,52,57,62,67,7...
Text Solution
|
- Find the value of "x" if mode of the following data is 5. find x. 2,...
Text Solution
|
- The median of the following observations arranged in ascending order i...
Text Solution
|
- Find the median of the first 10 natural numbers. Is it equal to their ...
Text Solution
|
- The mean of 40 observations was 160. It was detected on rechecking ...
Text Solution
|