


Similar Questions
Explore conceptually related problems
Recommended Questions
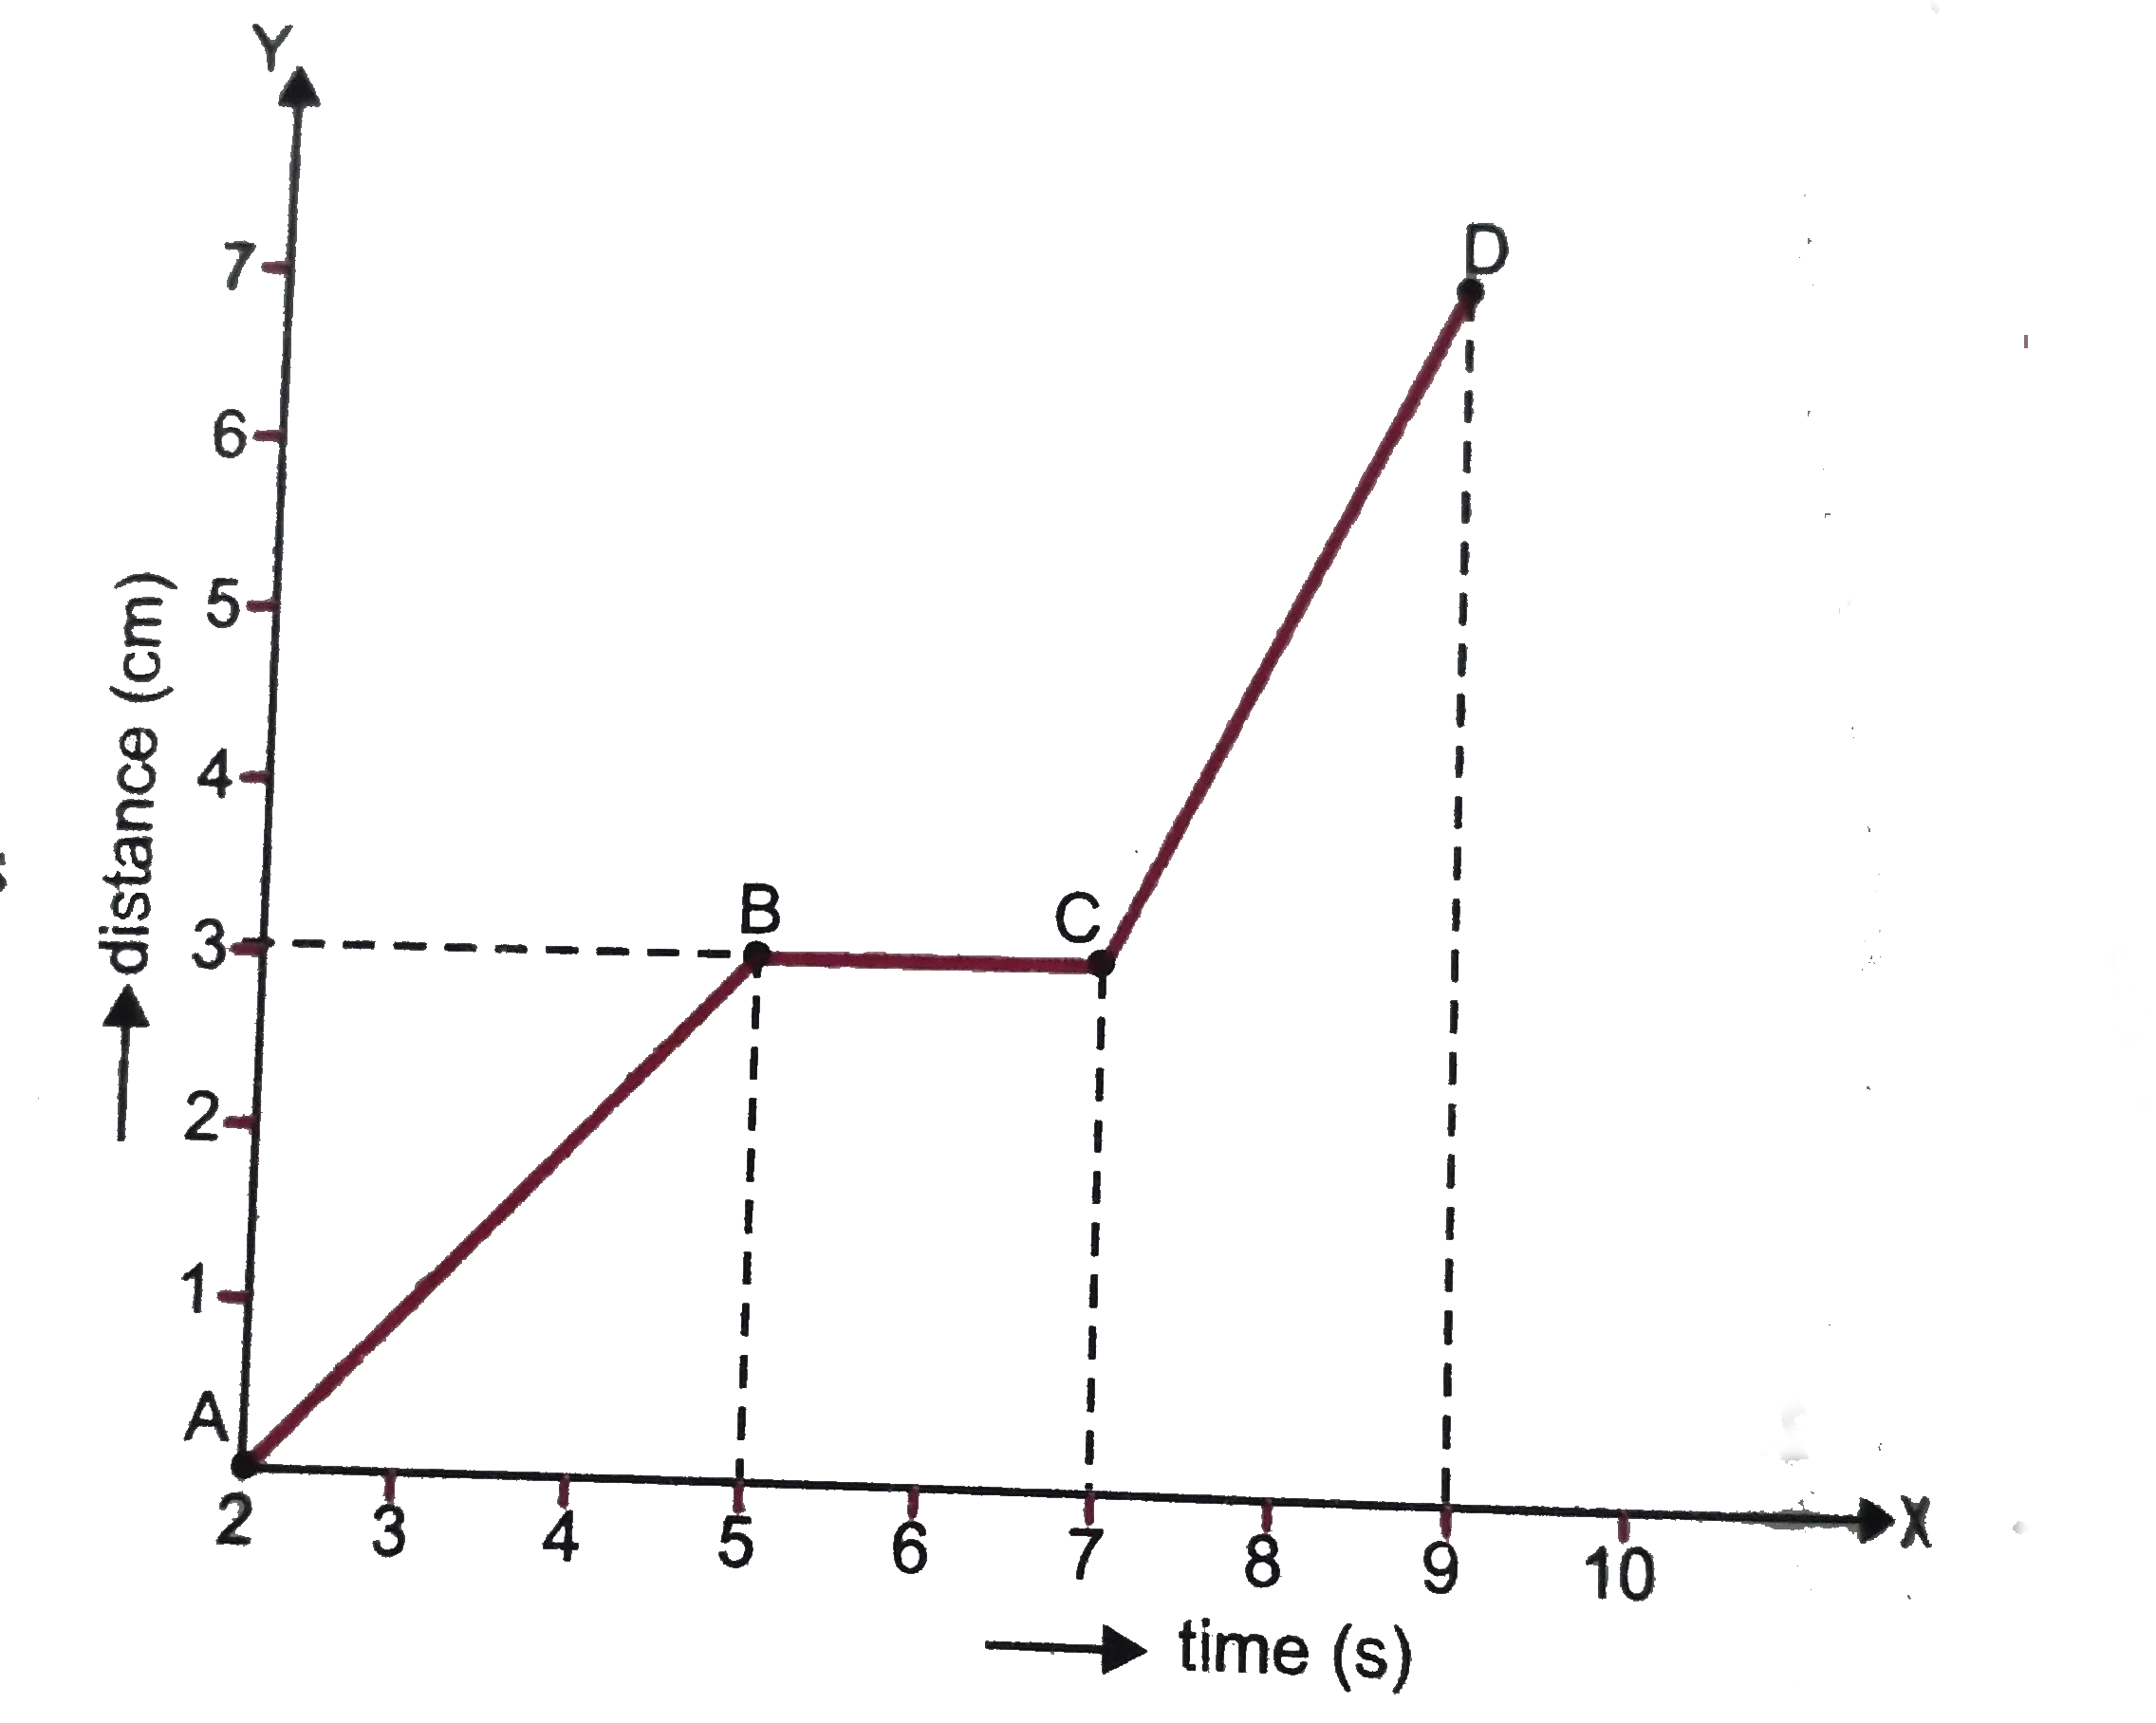
- The graph in Figure shows the positions of a body at different times. ...
Text Solution
|
- The graph in Figure shows the positions of a body at different times. ...
Text Solution
|
- A body A is at rest and body B is moving with a constant velocity. Dra...
Text Solution
|
- The speed time graph of a body is as shown in Figure. Calculate (i) ...
Text Solution
|
- The speed time graph of a body of mass 50kg is shown in (figure). Calc...
Text Solution
|
- The graph given alongside shows the positions of a body at different t...
Text Solution
|
- Give alongside is the velocity-time graph for a moving body: Find : (i...
Text Solution
|
- The following figure shows the velocity time graph of a body. Accordin...
Text Solution
|
- (a) a- i ,b-iii,c-ii (b) a-iii,b-ii,c- i (c) a-ii,b-iii,c- i (d) a-ii,...
Text Solution
|