


Similar Questions
Explore conceptually related problems
Recommended Questions
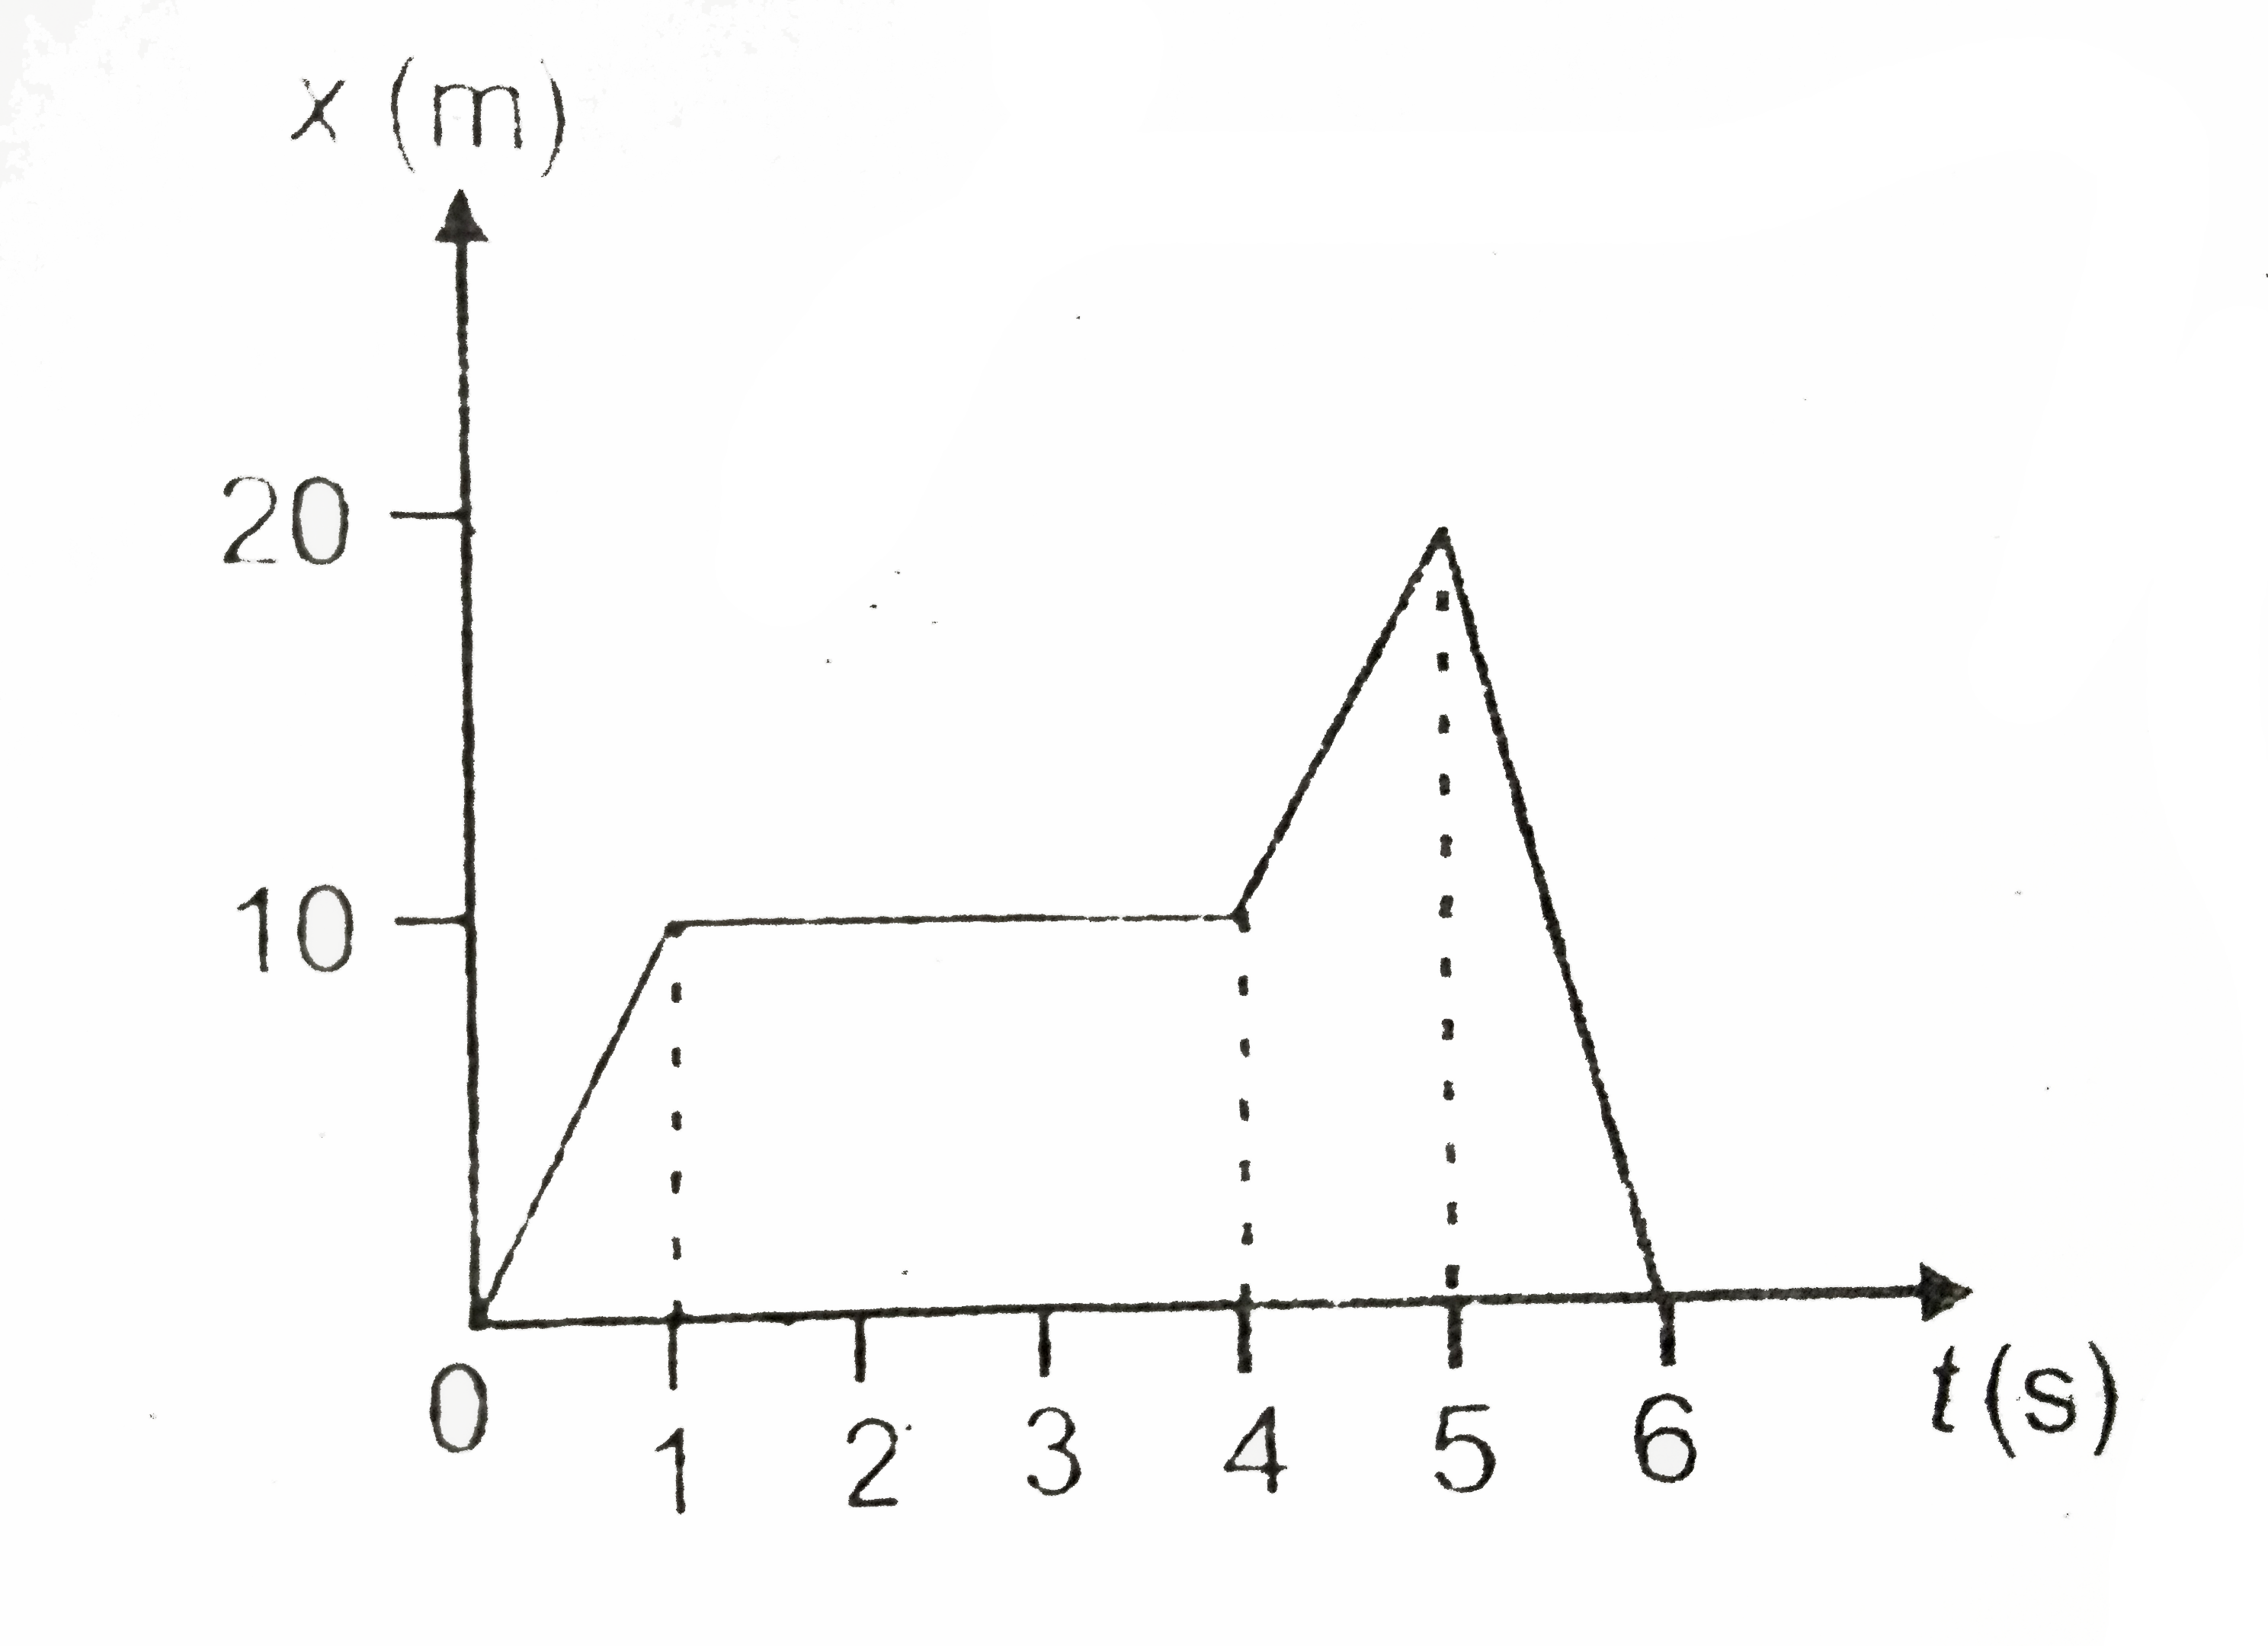
- Figure shows the graph of x-coordinate of a particle moving along x-ax...
Text Solution
|
- Figure shows x-t graph of a particle. Find the Time T Such that the Av...
Text Solution
|
- Fig. shows the graph of the x-coordinate of a particle going along the...
Text Solution
|
- Figure shows the velocity time graph of a particle moving along straig...
Text Solution
|
- The v-t graph for a particle moving along x-axis is shown in the figur...
Text Solution
|
- The acceleration-time graph of a particle moving along x-axis is shown...
Text Solution
|
- Figure shows the graph of x-coordinate of a particle moving along x-ax...
Text Solution
|
- Figure shows the graph of x - coordinate of a particle moving along x ...
Text Solution
|
- The acceleration - time graph for a particle moving along x - axis is ...
Text Solution
|