


Similar Questions
Explore conceptually related problems
Recommended Questions
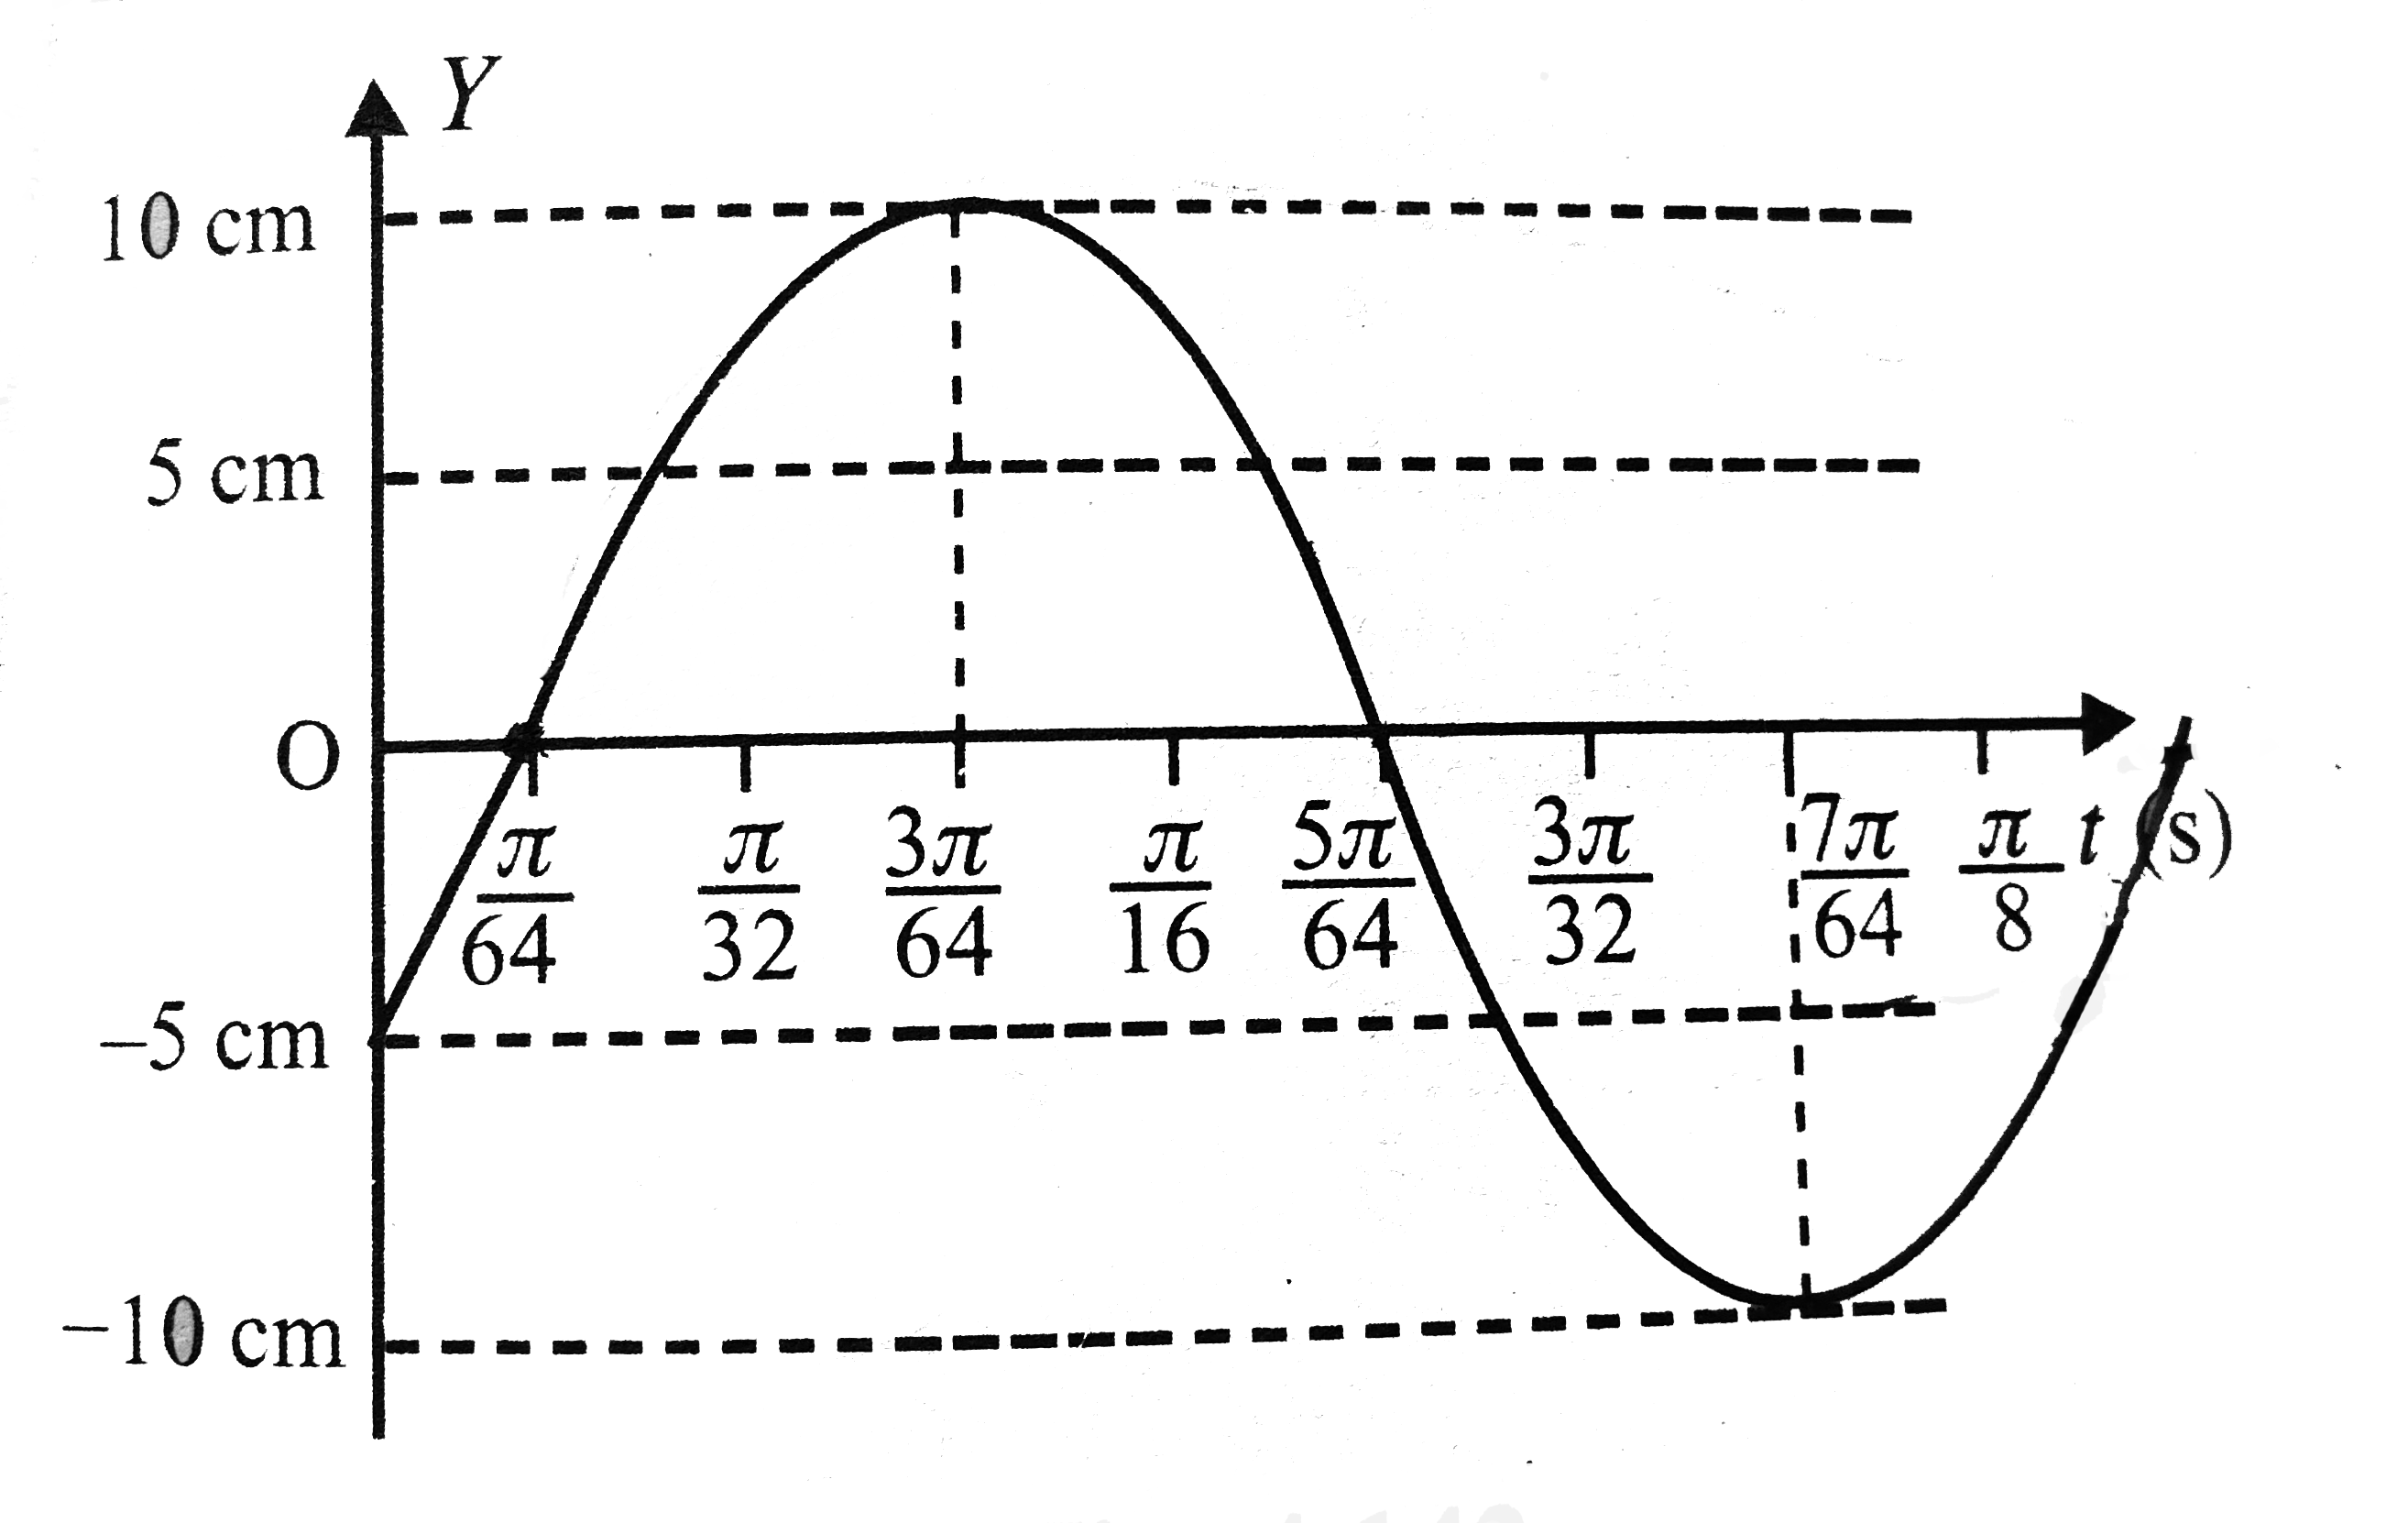
- The diagram below shows a sinusoidal curve. The equation of the curve ...
Text Solution
|
- The diagram below shows a sinusoidal curve. The equation of the curve ...
Text Solution
|
- The diagram shows stress v/s strain curve for the materials A and B. F...
Text Solution
|
- Figure given below shows three velocity-substrate concentration curves...
Text Solution
|
- With the help of a diagram show the sigmoid growth curve.
Text Solution
|
- चित्र में किसी पिंड का विस्थापन - समय आरेख दिखाया गया है | t lt0 तथा t...
Text Solution
|
- Show that AR curve and demand curve are the same.
Text Solution
|
- Draw rough diagrams to illustrate the following :(a) Open curve ...
Text Solution
|
- चित्र में दो पदार्थो के प्रतिबल-विकृति वक्र दर्शाए गए हैं, (समान स्केल...
Text Solution
|