


Similar Questions
Explore conceptually related problems
Recommended Questions
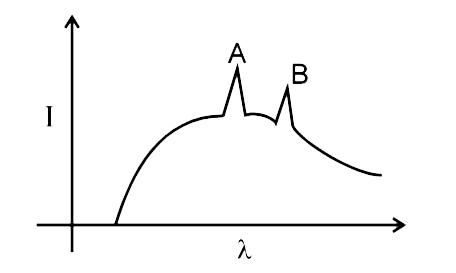
- Following diagram shows relation between emitted X-rays intensity and ...
Text Solution
|
- The shorted wavelength of X- rays emitted from an X- rays tube depends...
Text Solution
|
- In an X - rays tube , the intensity of the emitted X - rays beam is in...
Text Solution
|
- The figure represents the observed intensity of X - rays emitted by an...
Text Solution
|
- Following diagram shows relation between emitted X-rays intensity and ...
Text Solution
|
- In an X-ray tube, the intensity of the emitted X-ray beam is increased...
Text Solution
|
- X-किरण नलिका से उत्सर्जित X-किरणों की न्यूनतम तरंगदैधर्य निर्भर करती ह...
Text Solution
|
- An X-ray tube operates at 10 kV. Show that, the ratio of X-ray wavelen...
Text Solution
|
- The fig. represents the observed intensity of X-rays emitted by an X-r...
Text Solution
|