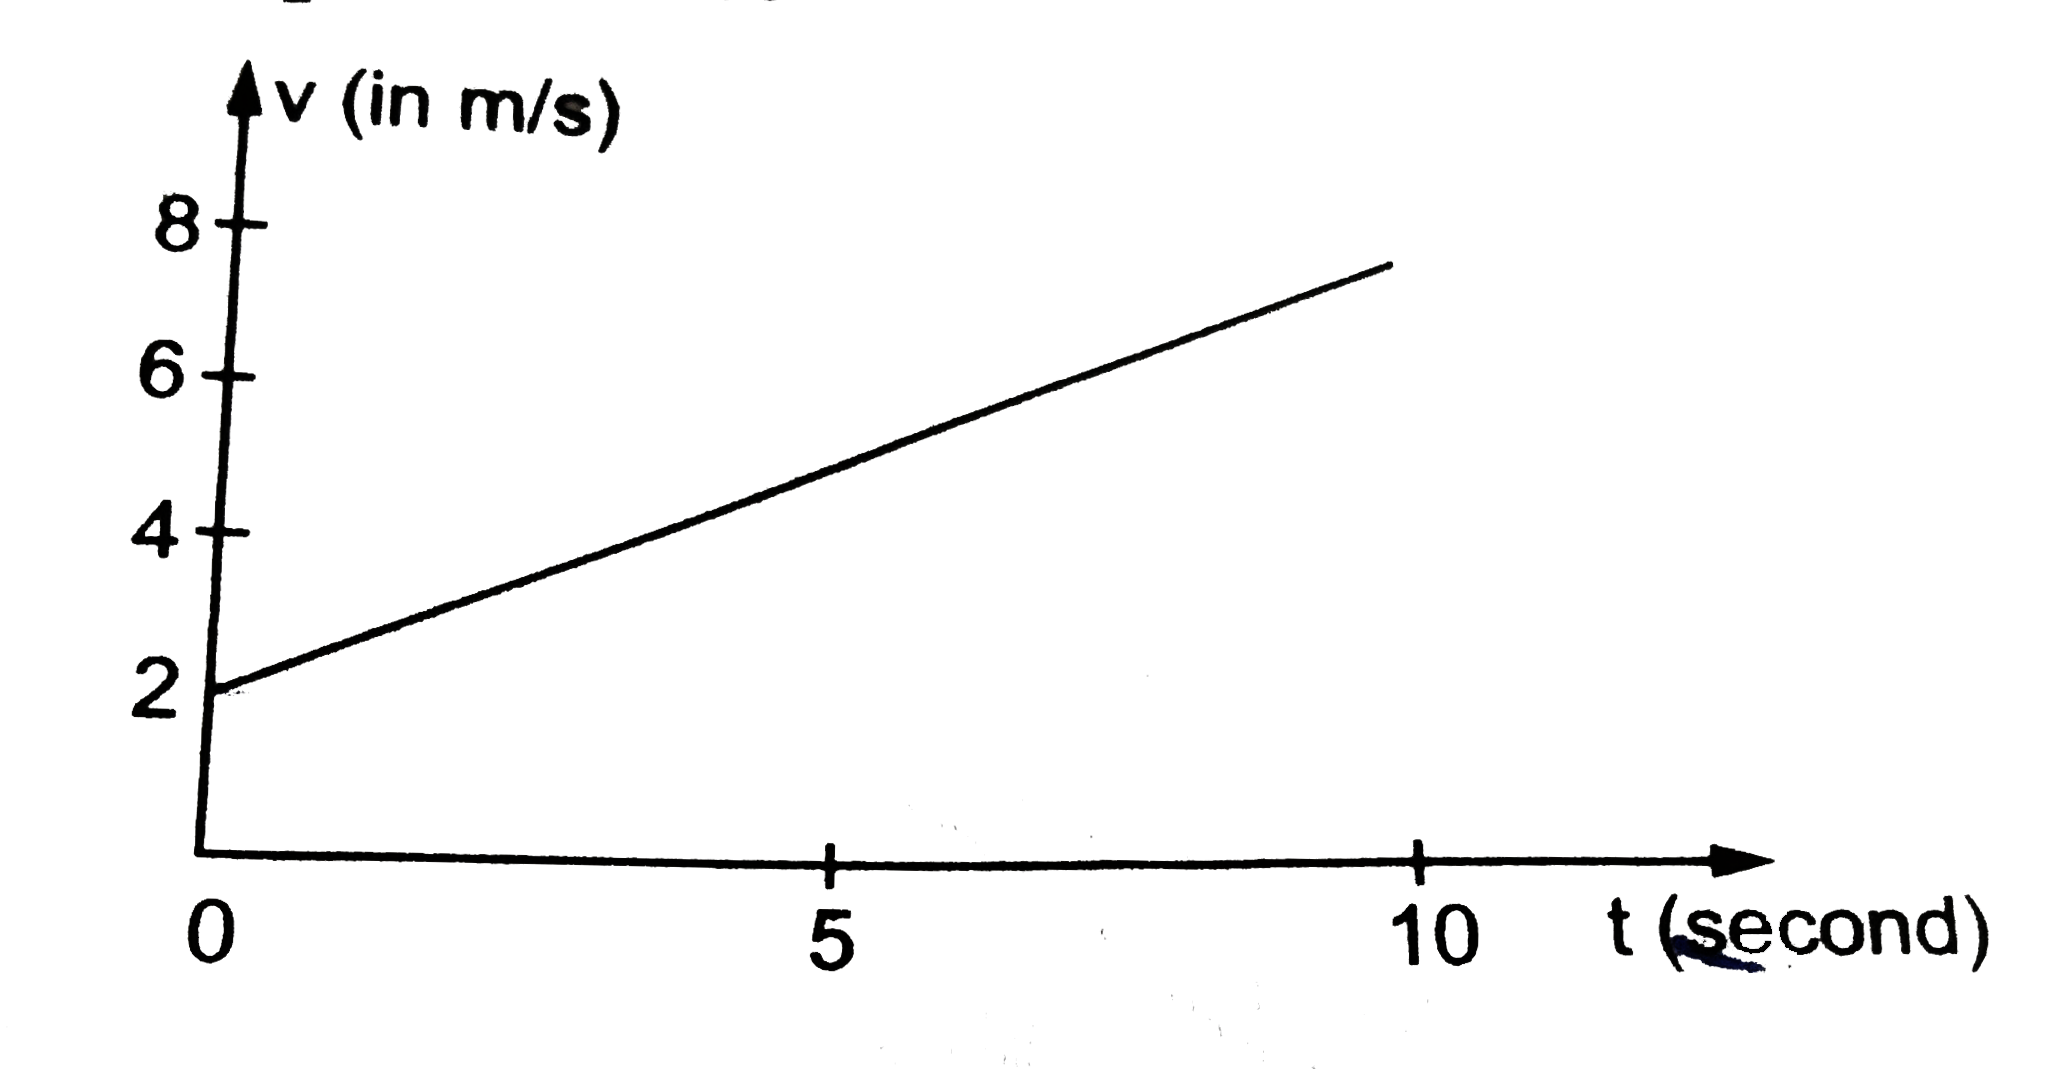
 shows the graph of velocity versus tie for a particle going along the X-axis. Find a. the acceleration, b. The distance travelled in 0 to 10 s and c. the displacement in 0 to 10 s.


Similar Questions
Explore conceptually related problems
Recommended Questions
- figure shows the graph of velocity versus tie for a particle going a...
Text Solution
|
- figure shows the graph of velocity versus tie for a particle going a...
Text Solution
|
- Figure shows the graph of the x-coordinaste of a particle going along ...
Text Solution
|
- Fig. shows the graph of velocity versus time for a partice going along...
Text Solution
|
- Fig. shows the graph of the x-coordinate of a particle going along the...
Text Solution
|
- A particle is moving along the x-axis. Consider it’s a-t graph. If ini...
Text Solution
|
- Velocity (v) versus displacement (s) graph of a particle moving in a s...
Text Solution
|
- A particle is moving along positive x direction and experiences a cons...
Text Solution
|
- The v-t graph for a particle moving along x-axis is shown in the figur...
Text Solution
|