


Similar Questions
Explore conceptually related problems
Recommended Questions
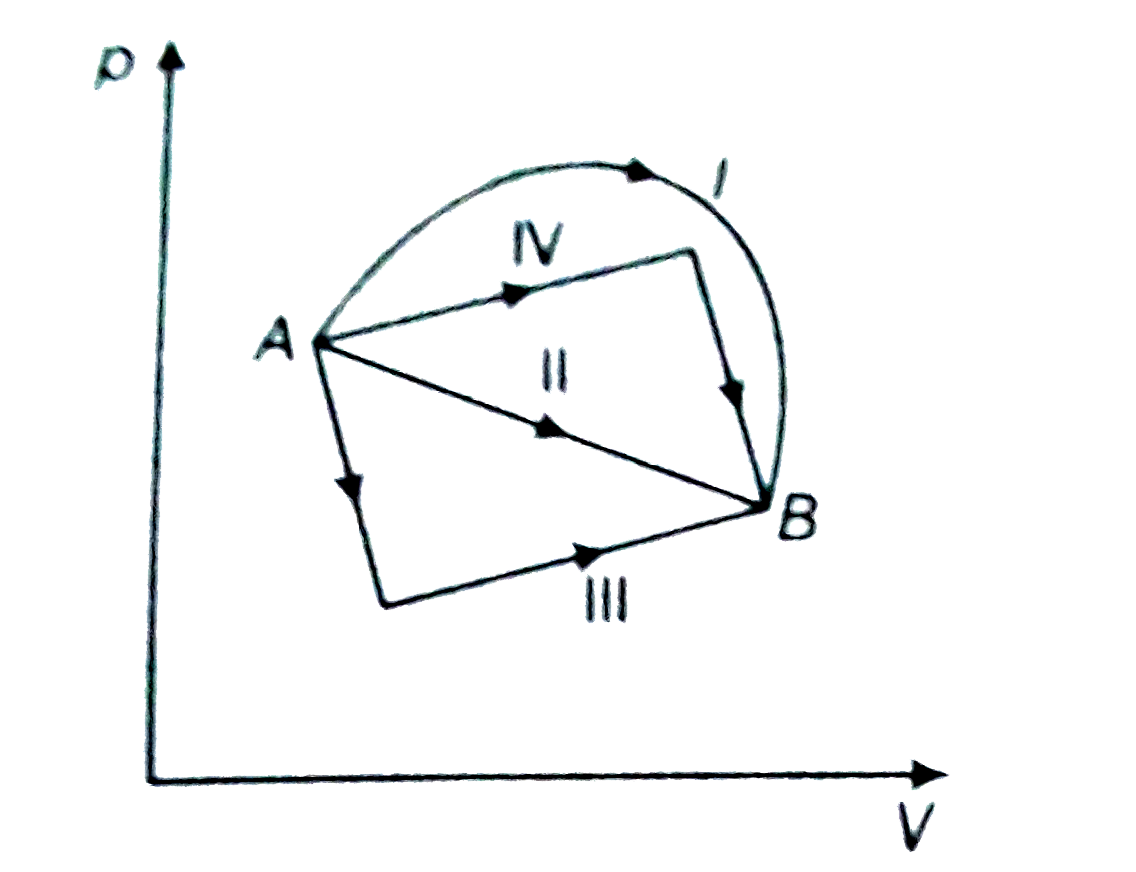
- Figure shows the p-V diagram of an ideal gas undergoing a change of st...
Text Solution
|
- (figure). Shows the P-V diagram of an ideal gas undergoing a change of...
Text Solution
|
- A diatomic ideal gas undergoes a thermodynamic change according to the...
Text Solution
|
- Figure shows the p-V diagram of an ideal gas undergoing a change of st...
Text Solution
|
- Fig. shows the P-V diagram of an ideal gas undergoing a change of stat...
Text Solution
|
- A diatomic ideal gas undergoes a thermodynainic change according to th...
Text Solution
|
- An ideal gas undergoes four different processes from the same initial ...
Text Solution
|
- Figure shows the P- V diagram of an ideal gas undergoing a change of s...
Text Solution
|
- The given P - V diagram is showing an ideal gas undergoing a change of...
Text Solution
|