


Similar Questions
Explore conceptually related problems
Recommended Questions
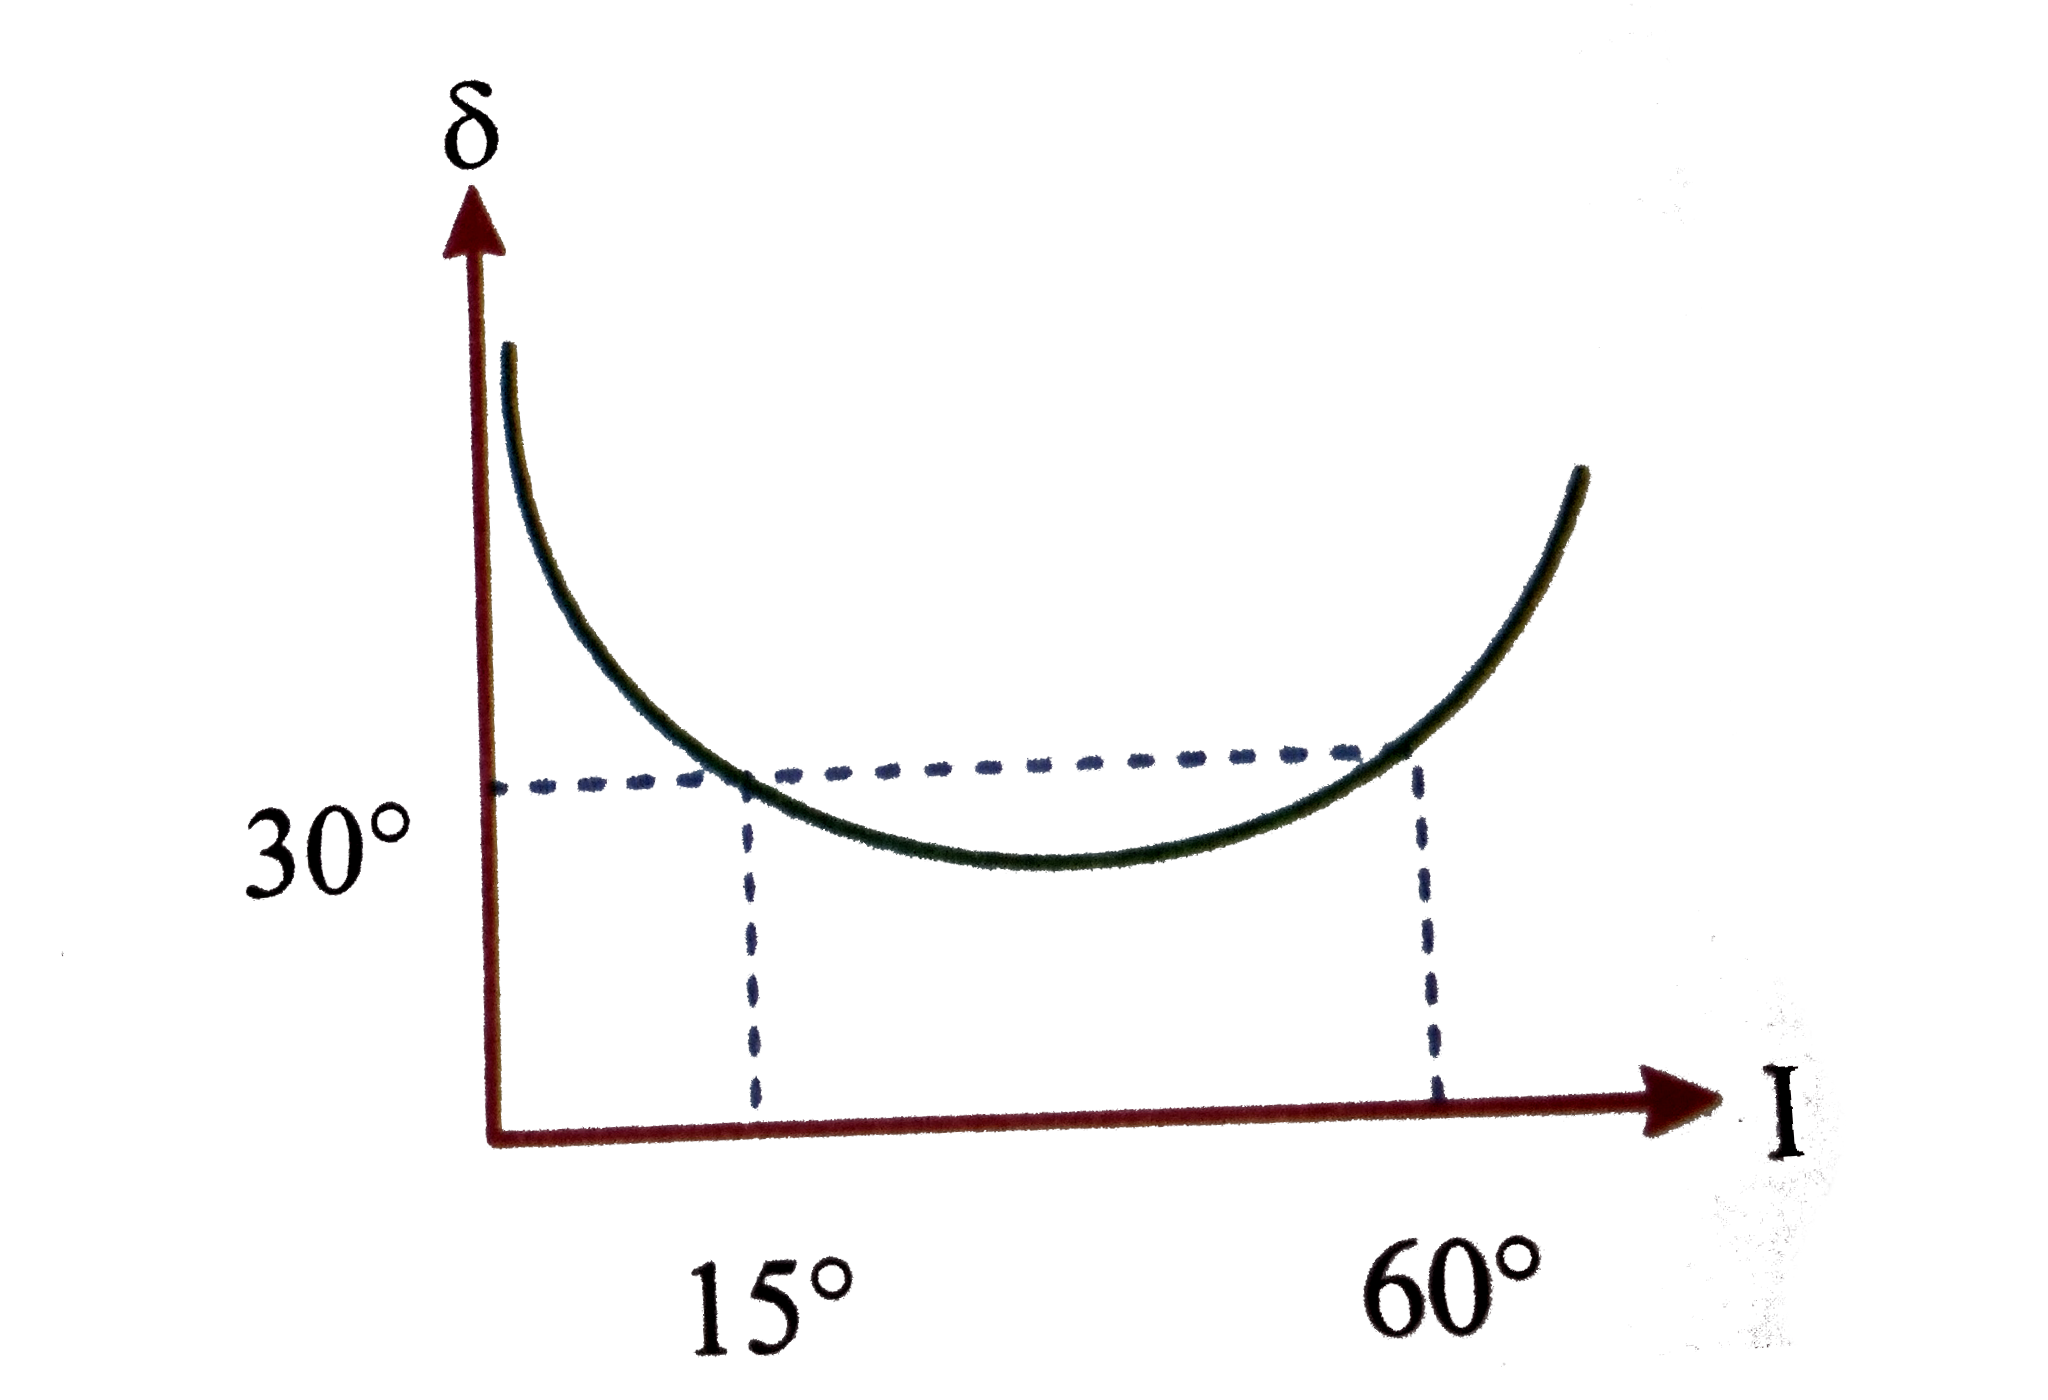
- Figure shows the graph of angle of deviation del versus angle of incid...
Text Solution
|
- Figure shows the graph of angle of deviation del versus angle of incid...
Text Solution
|
- The angle of a prism is 60^(@) When light is incident at an angle of 6...
Text Solution
|
- The angle of a prism is 60^(@) . When light is incident at an angle of...
Text Solution
|
- Figure shown the graph of angle of deviation delta verses angle of inc...
Text Solution
|
- Figure shows graph of deviation delta versus angle of incidence for a ...
Text Solution
|
- A ray of light is incident on one face of a prism at an angle of 50^(@...
Text Solution
|
- Draw a graph of angle of deviation versus the angle of incidence in a ...
Text Solution
|
- The refracting angle of an equilateral prism is A. Derive an expressio...
Text Solution
|