A
B
C
D
Text Solution
Verified by Experts
The correct Answer is:


Topper's Solved these Questions
GEOMETRICAL OPTICS
ALLEN|Exercise EXERCISE - 05 (B) (MATCH THE COLUMN)|3 VideosGEOMETRICAL OPTICS
ALLEN|Exercise EXERCISE - 05 (B) (ASSERTION & REASON )|9 VideosGEOMETRICAL OPTICS
ALLEN|Exercise EXERCISE - 05 (B)|58 VideosCURRENT ELECTRICITY
ALLEN|Exercise All Questions|427 VideosGRAVITATION
ALLEN|Exercise EXERCISE 4|9 Videos
Similar Questions
Explore conceptually related problems
ALLEN-GEOMETRICAL OPTICS-EXERCISE - 05 (B) (MCQ)
- Let barv,v(rms) and vp respectively denote the mean speed. Root mean s...
Text Solution
|
- During the melting of a slab of ice at 273K at atmospheric pressure,
Text Solution
|
- A bimetallic strip is formed out of two identical strips one of copper...
Text Solution
|
- C(p) and C(v) denote the molar specific heat capacities of a gas at co...
Text Solution
|
- The figure shows the P-V plot of an ideal gas taken through a cycle AB...
Text Solution
|
- The figure below shows the variation of specific heat capacity (C) of ...
Text Solution
|
- A container of fixed volume has a mixture of a one mole of hydrogen an...
Text Solution
|
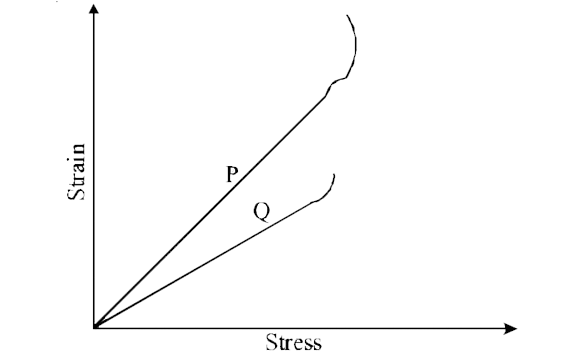
- In plotting stress versus strain curves for two materials P and Q, a s...
Text Solution
|
- An ideal monoatomic gas is confined in a horizontal cylinder by a spri...
Text Solution
|