


NARAYNA-ATOMIC STRUCTURE-All Questions
- Give the correct order of initials T(true)F(false) for following satem...
Text Solution
|
- Which of the following statements is/are true in the correct of photoe...
Text Solution
|
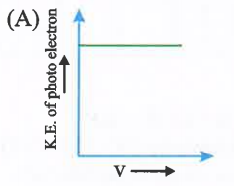
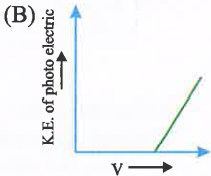
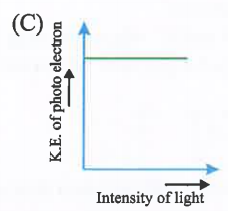
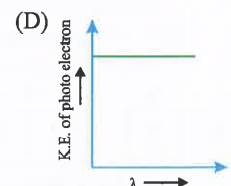
- Which is correct graph for photoelectric effect.
Text Solution
|
- Which of the following is correct regarding Heisenberg's uncertainity ...
Text Solution
|
- In Bohr model of the hydrogen atom, let R,v and E represent the radiu...
Text Solution
|
- In a hydrogen like sample, electron is in 2nd excied state. The Bindin...
Text Solution
|
- 1st excitation potential for the H-like (hypothetical) sample is 24 V....
Text Solution
|
- A hydrogen like atom in ground state absorbs n photon having the sa...
Text Solution
|
- Which of the following is/are correct?
Text Solution
|
- Choose the correct statement(s):
Text Solution
|
- For radial probability curves. Which of the following is/are correct ?
Text Solution
|
- Select the correct statement(s):
Text Solution
|
- Select the correct statement(s):
Text Solution
|
- An excited state of H atom emits a photon of wavelength lamda and retu...
Text Solution
|
- The radial distribution functions [P(r)] is used to determine the most...
Text Solution
|
- Which of the following statement(s) is/are correct?
Text Solution
|
- Statement-1: Photon has definite momentum though it has no rest mass. ...
Text Solution
|
- Statement-1: The orbital angular momentum of d-electron in orbitals is...
Text Solution
|
- STATEMENT-1: The ground state electronic configuration of introgen is ...
Text Solution
|
- When electron jumps from higher orbit to lower orbit, then energy is r...
Text Solution
|