Text Solution
Verified by Experts


Topper's Solved these Questions
LINEAR EQUATIONS IN TWO VARIABLES
NAGEEN PRAKASHAN|Exercise Exercise|3 VideosLINEAR EQUATIONS IN TWO VARIABLES
NAGEEN PRAKASHAN|Exercise Revision Exercise|12 VideosLINEAR EQUATIONS IN TWO VARIABLES
NAGEEN PRAKASHAN|Exercise Revision Exercise|12 VideosINTRODUCTION TO EUCLID'S GEOMETRY
NAGEEN PRAKASHAN|Exercise Exercise|3 VideosLINES AND ANGLES
NAGEEN PRAKASHAN|Exercise Revision Exercise (long Answer Questions )|6 Videos
Similar Questions
Explore conceptually related problems
NAGEEN PRAKASHAN-LINEAR EQUATIONS IN TWO VARIABLES-Problems From NCERT/exemplar
- If the point (3,4) lies on the graph of the equation 3y -ax -7 =0 find...
Text Solution
|
- The taxi fare in a city is as follows: For the first kilometre, the fa...
Text Solution
|
- From the choices given below choose the equation whose graphs are give...
Text Solution
|
- If the work done by a body on application of a constant force is di...
Text Solution
|
- Yamini and Fatima, two students of Class IX of a school, together c...
Text Solution
|
- In countries like USA and Canada, temperature is measured in Fahrenhe...
Text Solution
|
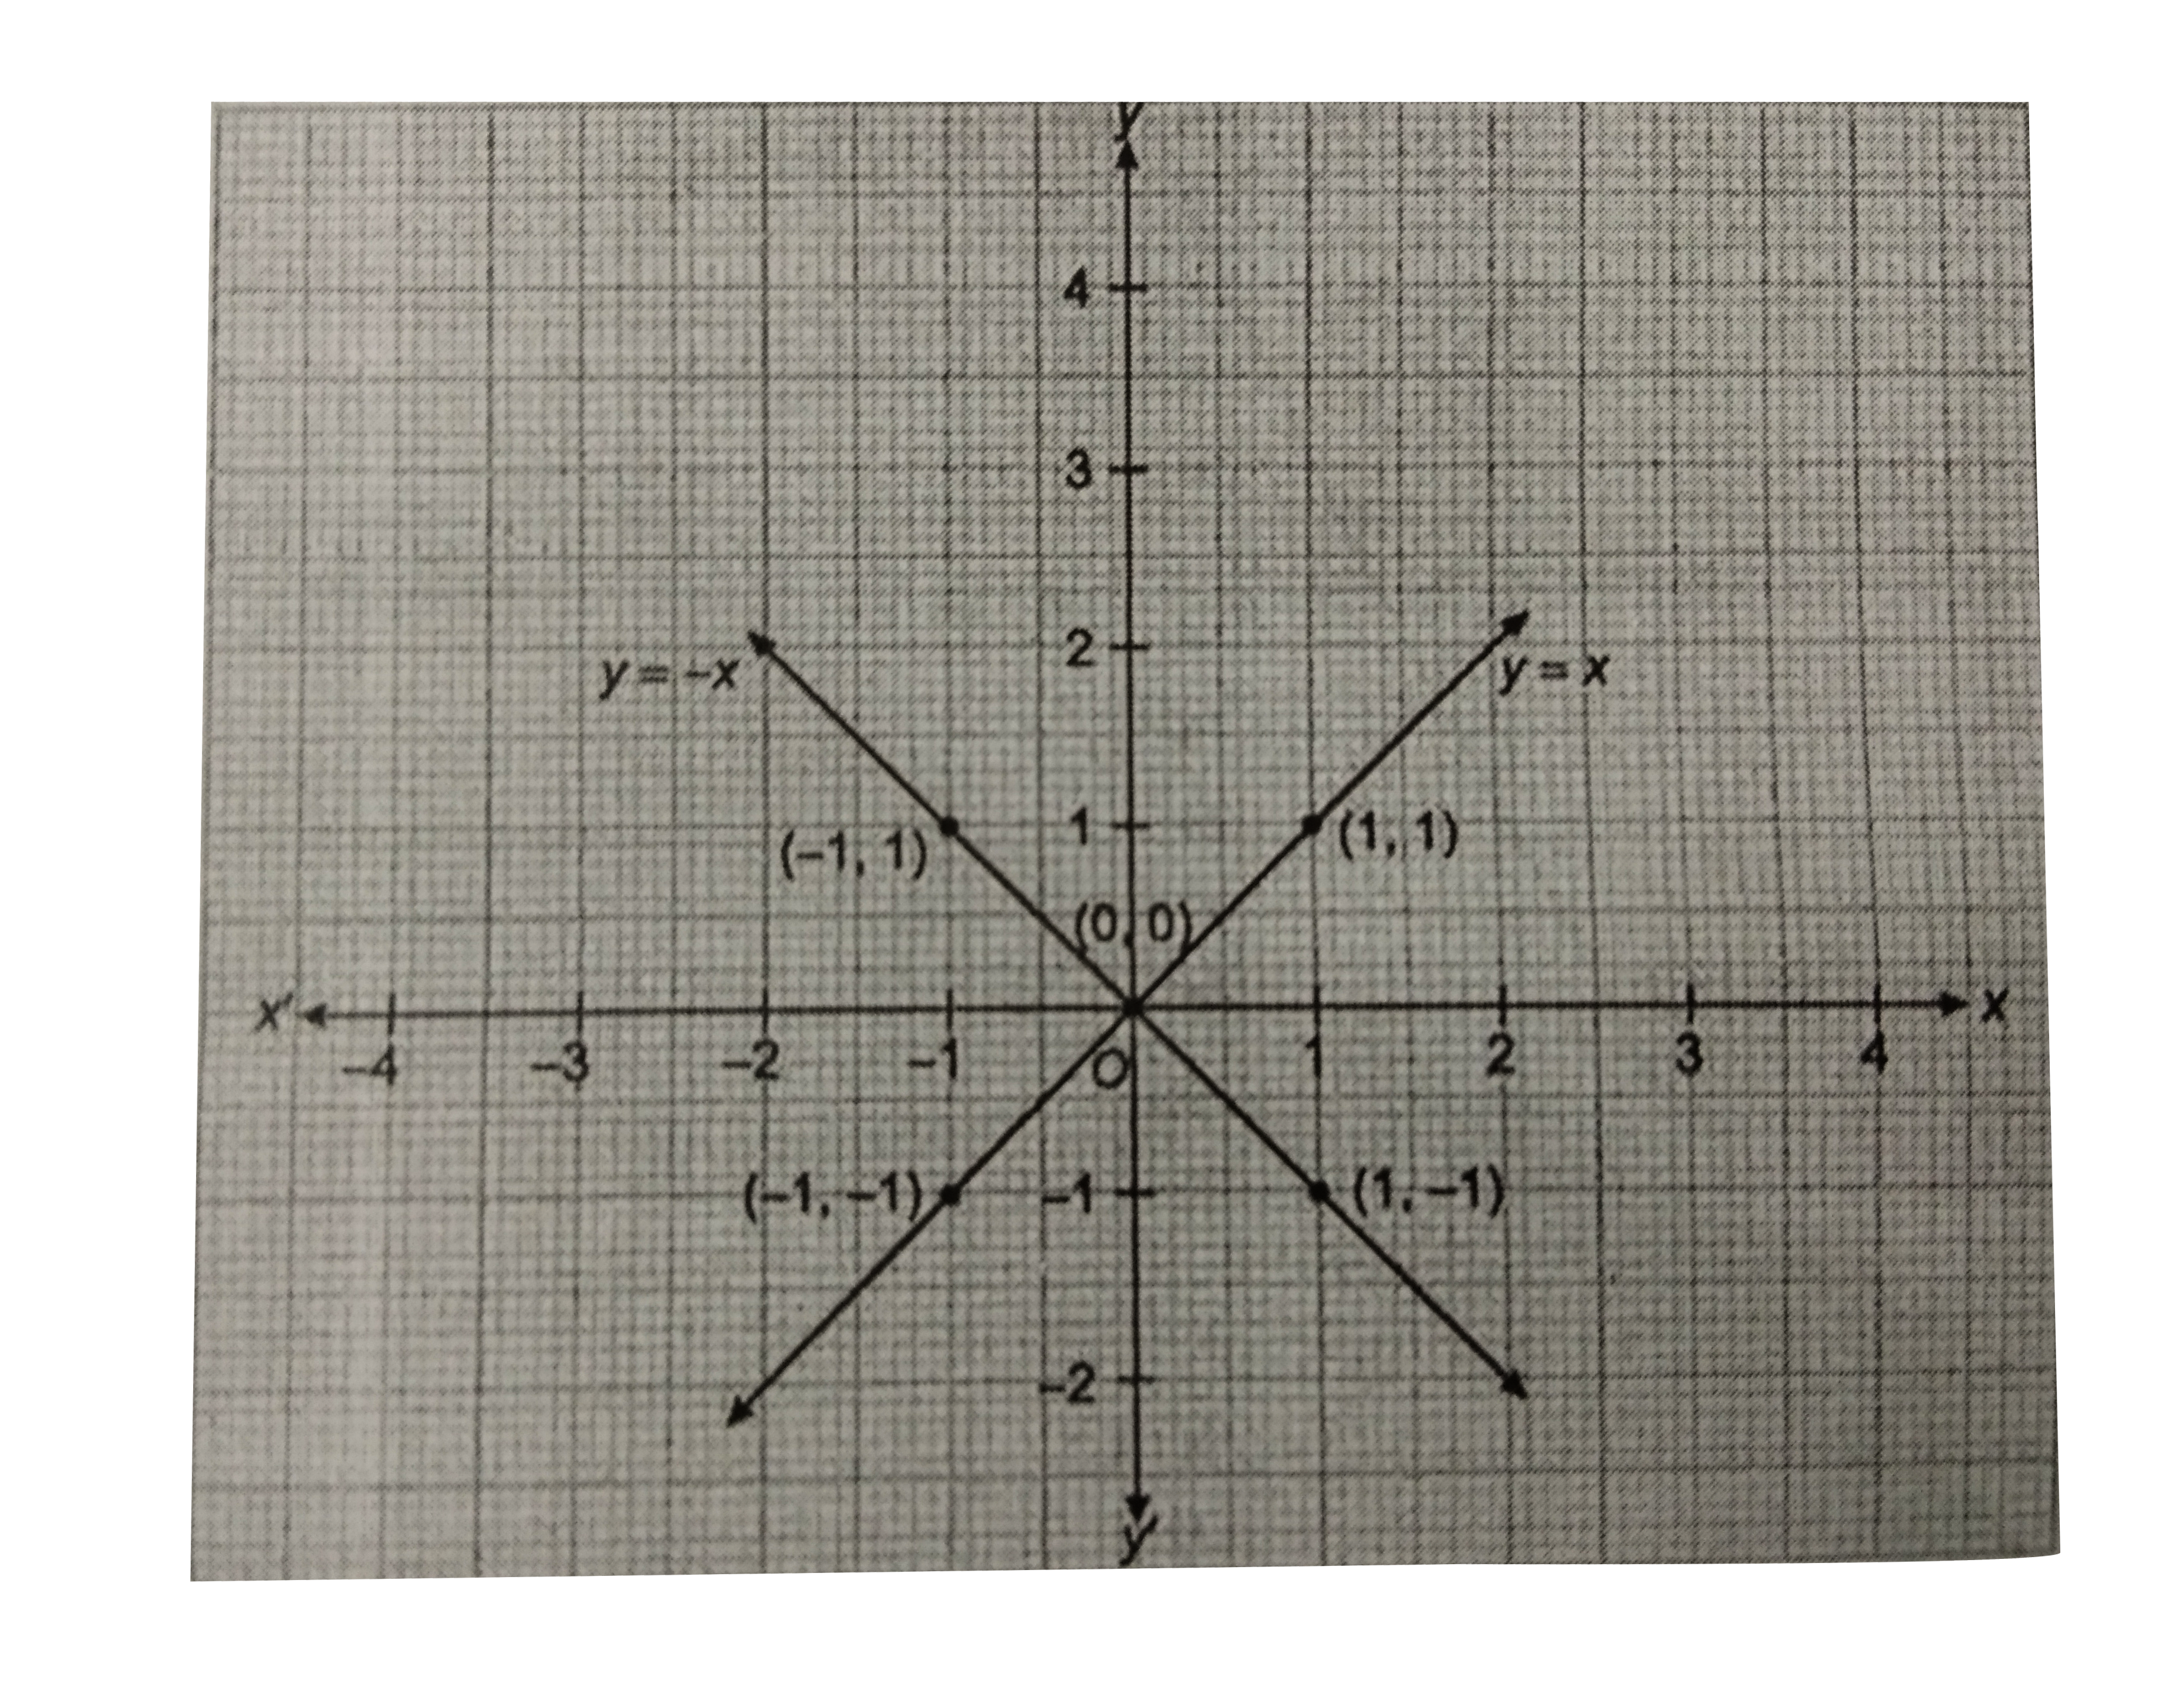
- Draw the graphs of linear equations y=x and y=-x on the same cartesian...
Text Solution
|