 .
. A
B
C
D
Text Solution
Verified by Experts
The correct Answer is:


Topper's Solved these Questions
MOTION IN A STRAIGHT LINE
NCERT FINGERTIPS|Exercise Acceleration|19 VideosMOTION IN A STRAIGHT LINE
NCERT FINGERTIPS|Exercise Kinematic Equations For Uniformly Accelerated Motion|32 VideosMOTION IN A STRAIGHT LINE
NCERT FINGERTIPS|Exercise Average Velocity And Average Speed|8 VideosMOTION IN A PLANE
NCERT FINGERTIPS|Exercise Assertion And Reason|15 VideosOSCILLATIONS
NCERT FINGERTIPS|Exercise Assertion And Reason|15 Videos
Similar Questions
Explore conceptually related problems
NCERT FINGERTIPS-MOTION IN A STRAIGHT LINE-Instantaneous Velocity And Speed
- Speedometer of a car measures
Text Solution
|
- Speedometer measures the speed of the car in
Text Solution
|
- A particle moves with uniform velocity. Which of the following stateme...
Text Solution
|
- The position of and object moving along x-axis is gi en by x=a +bt^(2)...
Text Solution
|
- The motion of a particle is described by the equation x = a+bt^(2) whe...
Text Solution
|
- The motion of a particle is described by x = xo(1 - e^(-kt)),, tge, xo...
Text Solution
|
- The velocity of the particle at any time t is given by vu = 2t(3 - t) ...
Text Solution
|
- The motion of a body is given by the equation (dnu)/dt = 6 - 3nu where...
Text Solution
|
- The position x of a particle with respect to time t along x-axis is gi...
Text Solution
|
- Figure shows the displacement time graph of a particle moving on the X...
Text Solution
|
- Fig. 2 (NCT).9 show the x-t plot of a particle in one dimensional mot...
Text Solution
|
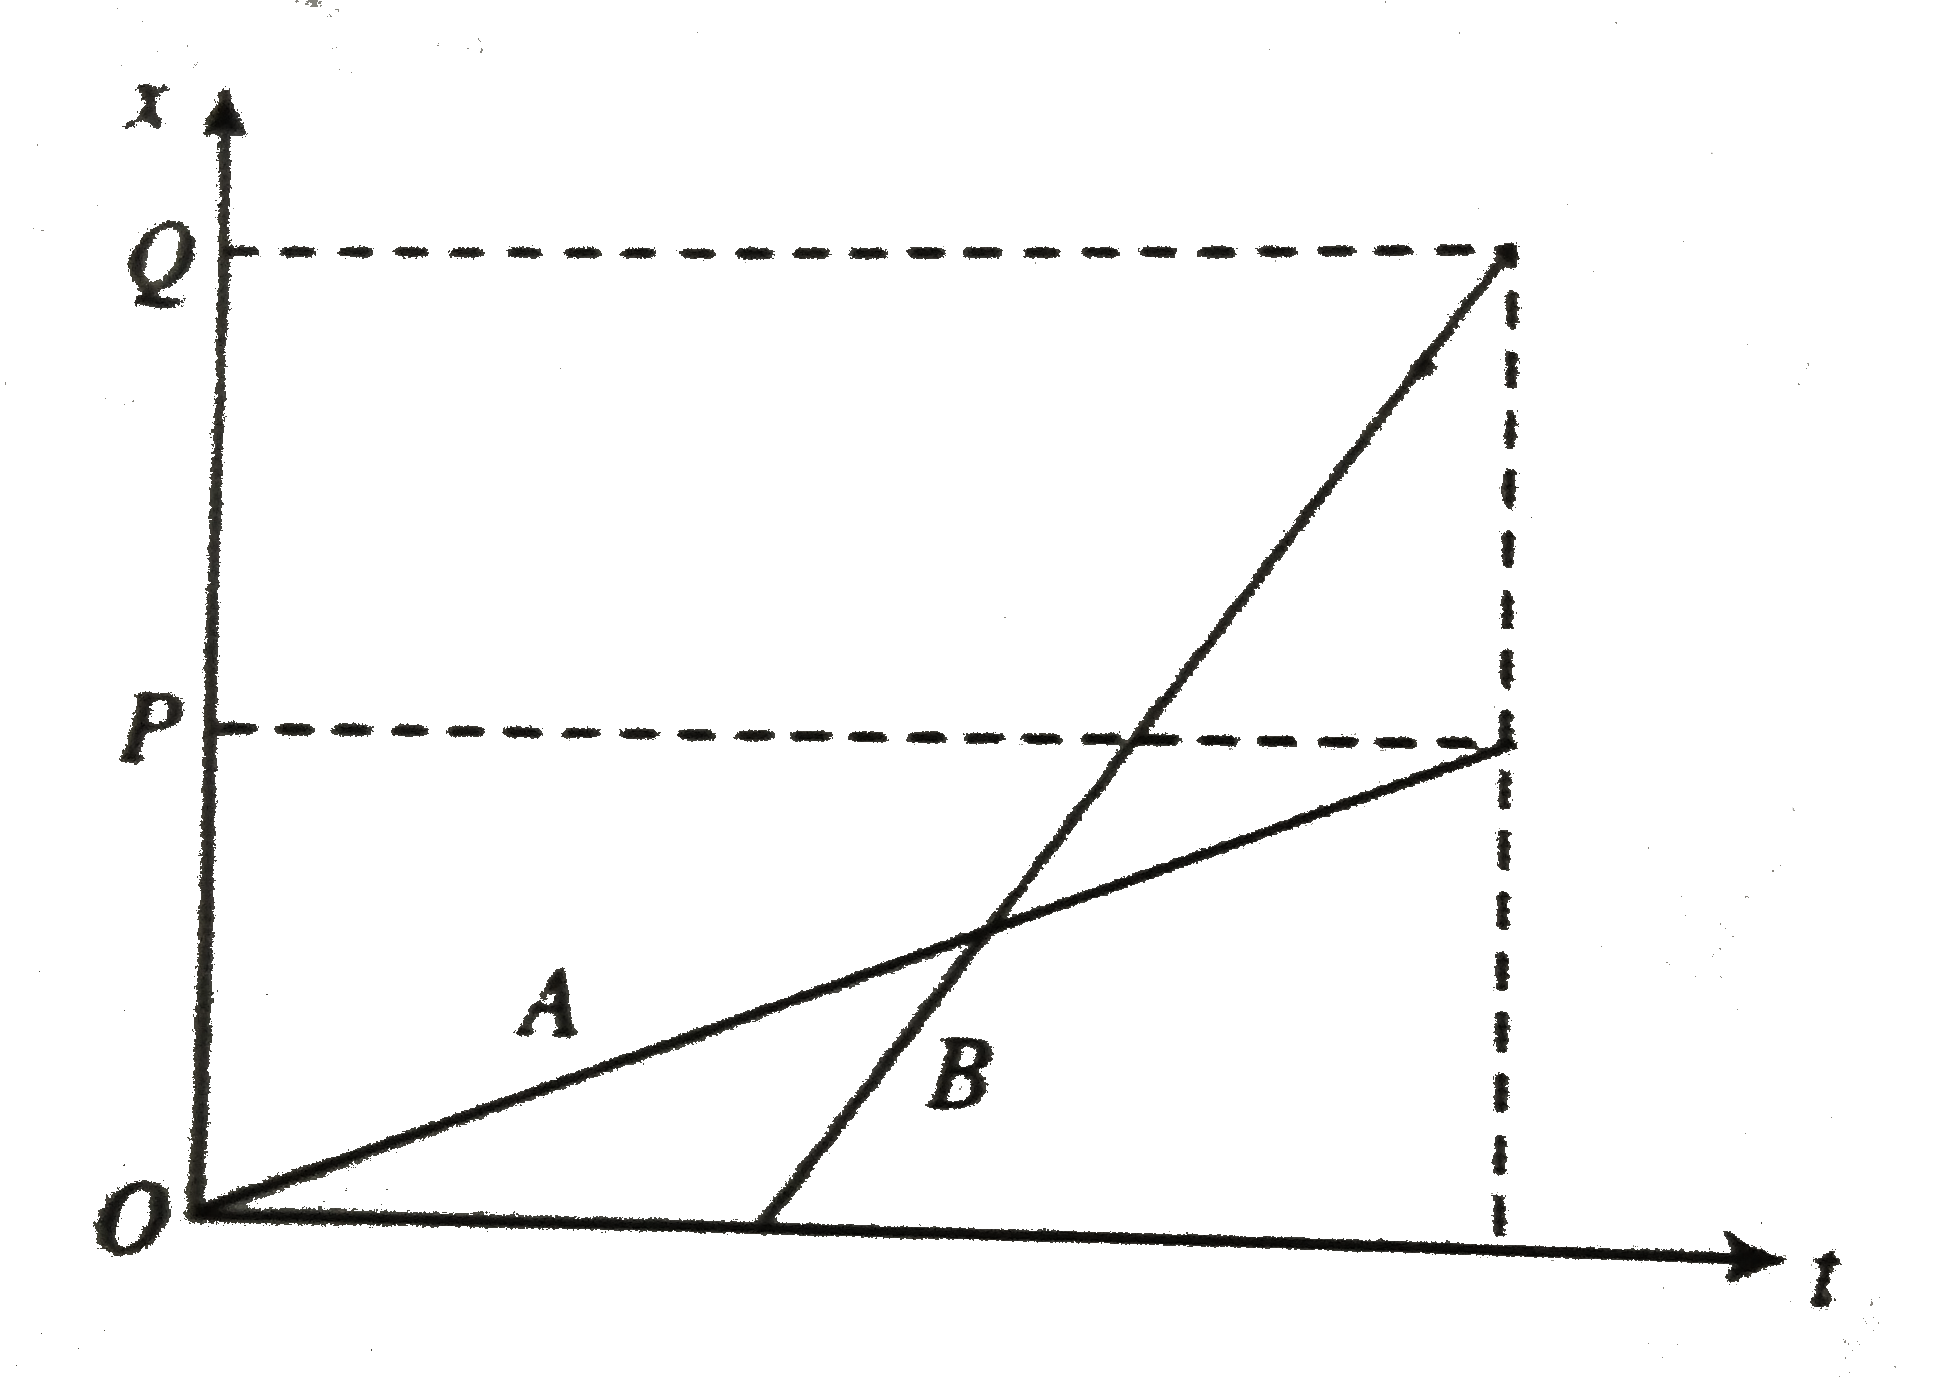
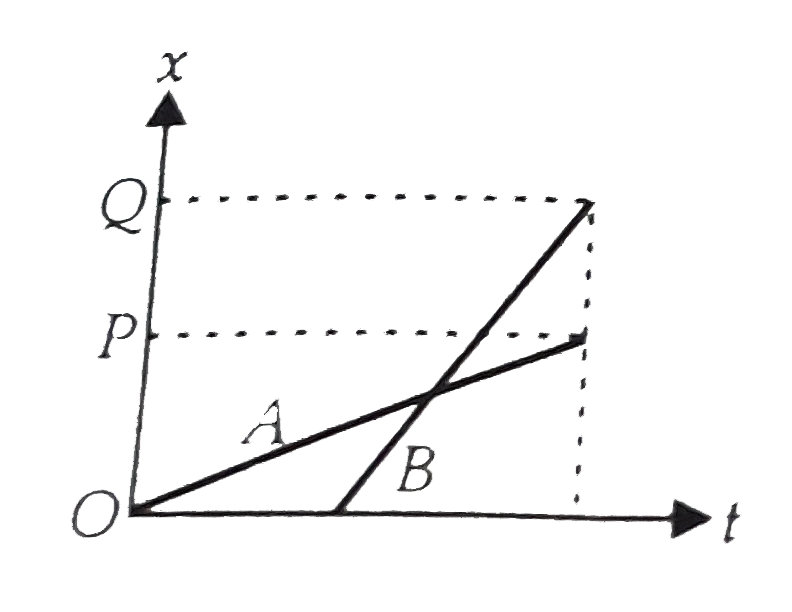
- The position-time (x-t) graphs for two children A and B returning from...
Text Solution
|
- The displacement-time graph of moving particle is shown below The...
Text Solution
|
- In the given v-t graph the distance travelled by the body in 5 seconds...
Text Solution
|
- The speed-time graph of a particle moving along a fixed direction as s...
Text Solution
|
- Which of the following graphs cannot possibly represent one dimensiona...
Text Solution
|