A
B
C
D
Text Solution
AI Generated Solution
The correct Answer is:


Topper's Solved these Questions
THERMODYNAMICS
NCERT FINGERTIPS|Exercise Thermodynamic State Variables|2 VideosTHERMODYNAMICS
NCERT FINGERTIPS|Exercise Thermodynamic Process|52 VideosTHERMODYNAMICS
NCERT FINGERTIPS|Exercise First Law Of Thermodynamics|5 VideosTHERMAL PROPERTIES OF MATTER
NCERT FINGERTIPS|Exercise Assertion And Reason|10 VideosUNITS AND MEASUREMENTS
NCERT FINGERTIPS|Exercise Assertion And Reason|15 Videos
Similar Questions
Explore conceptually related problems
NCERT FINGERTIPS-THERMODYNAMICS-Specific Heat Capacity
- a geyser heats water flowing at the rate of 4 litrre per minute from 3...
Text Solution
|
- Mayer's kformula for the relation between two principla specific heats...
Text Solution
|
- The ratio (Cp)/(Cv)=gamma for a gas. Its molecular weight is M. Its sp...
Text Solution
|
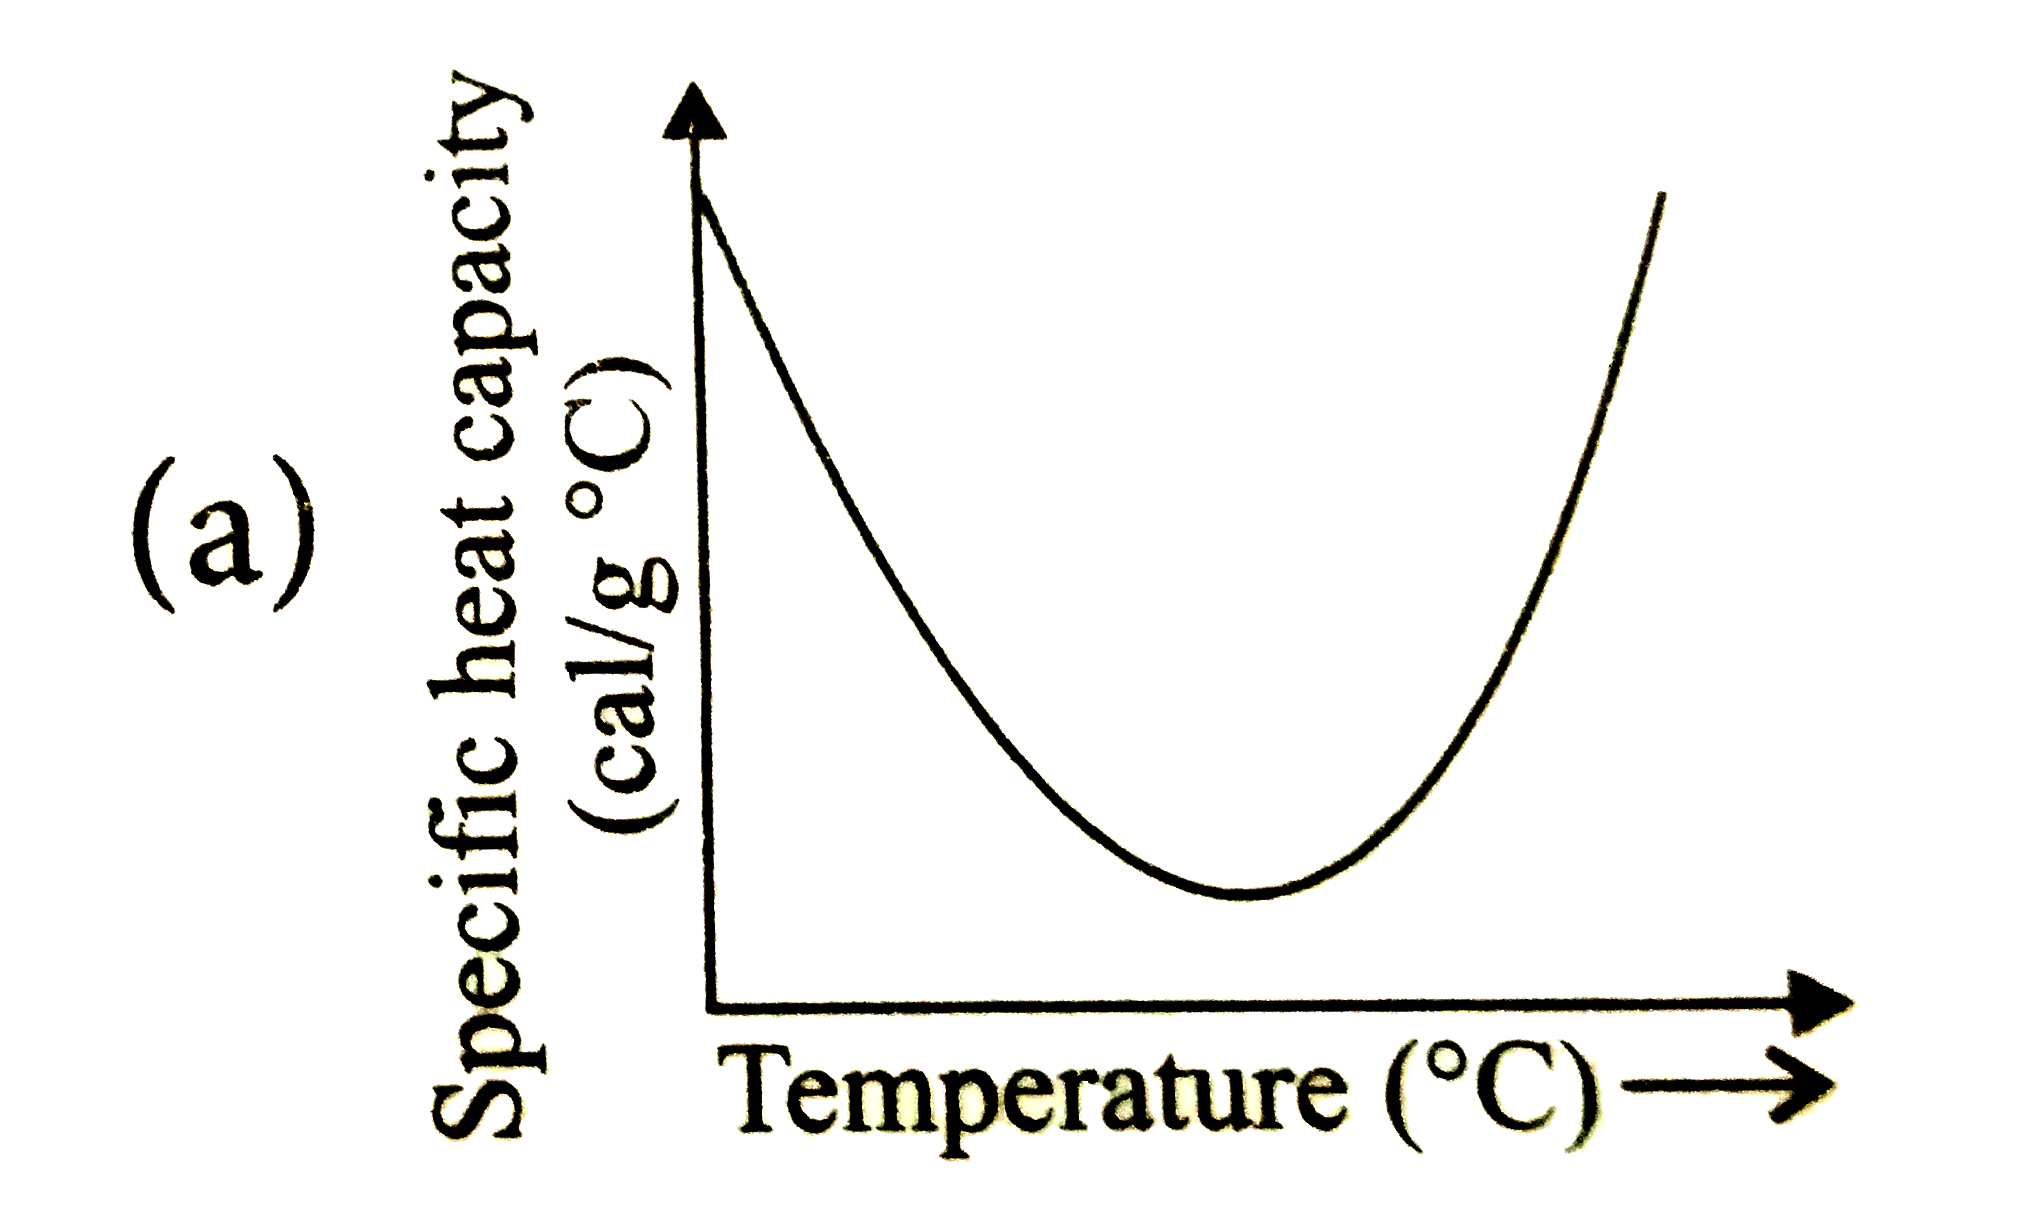
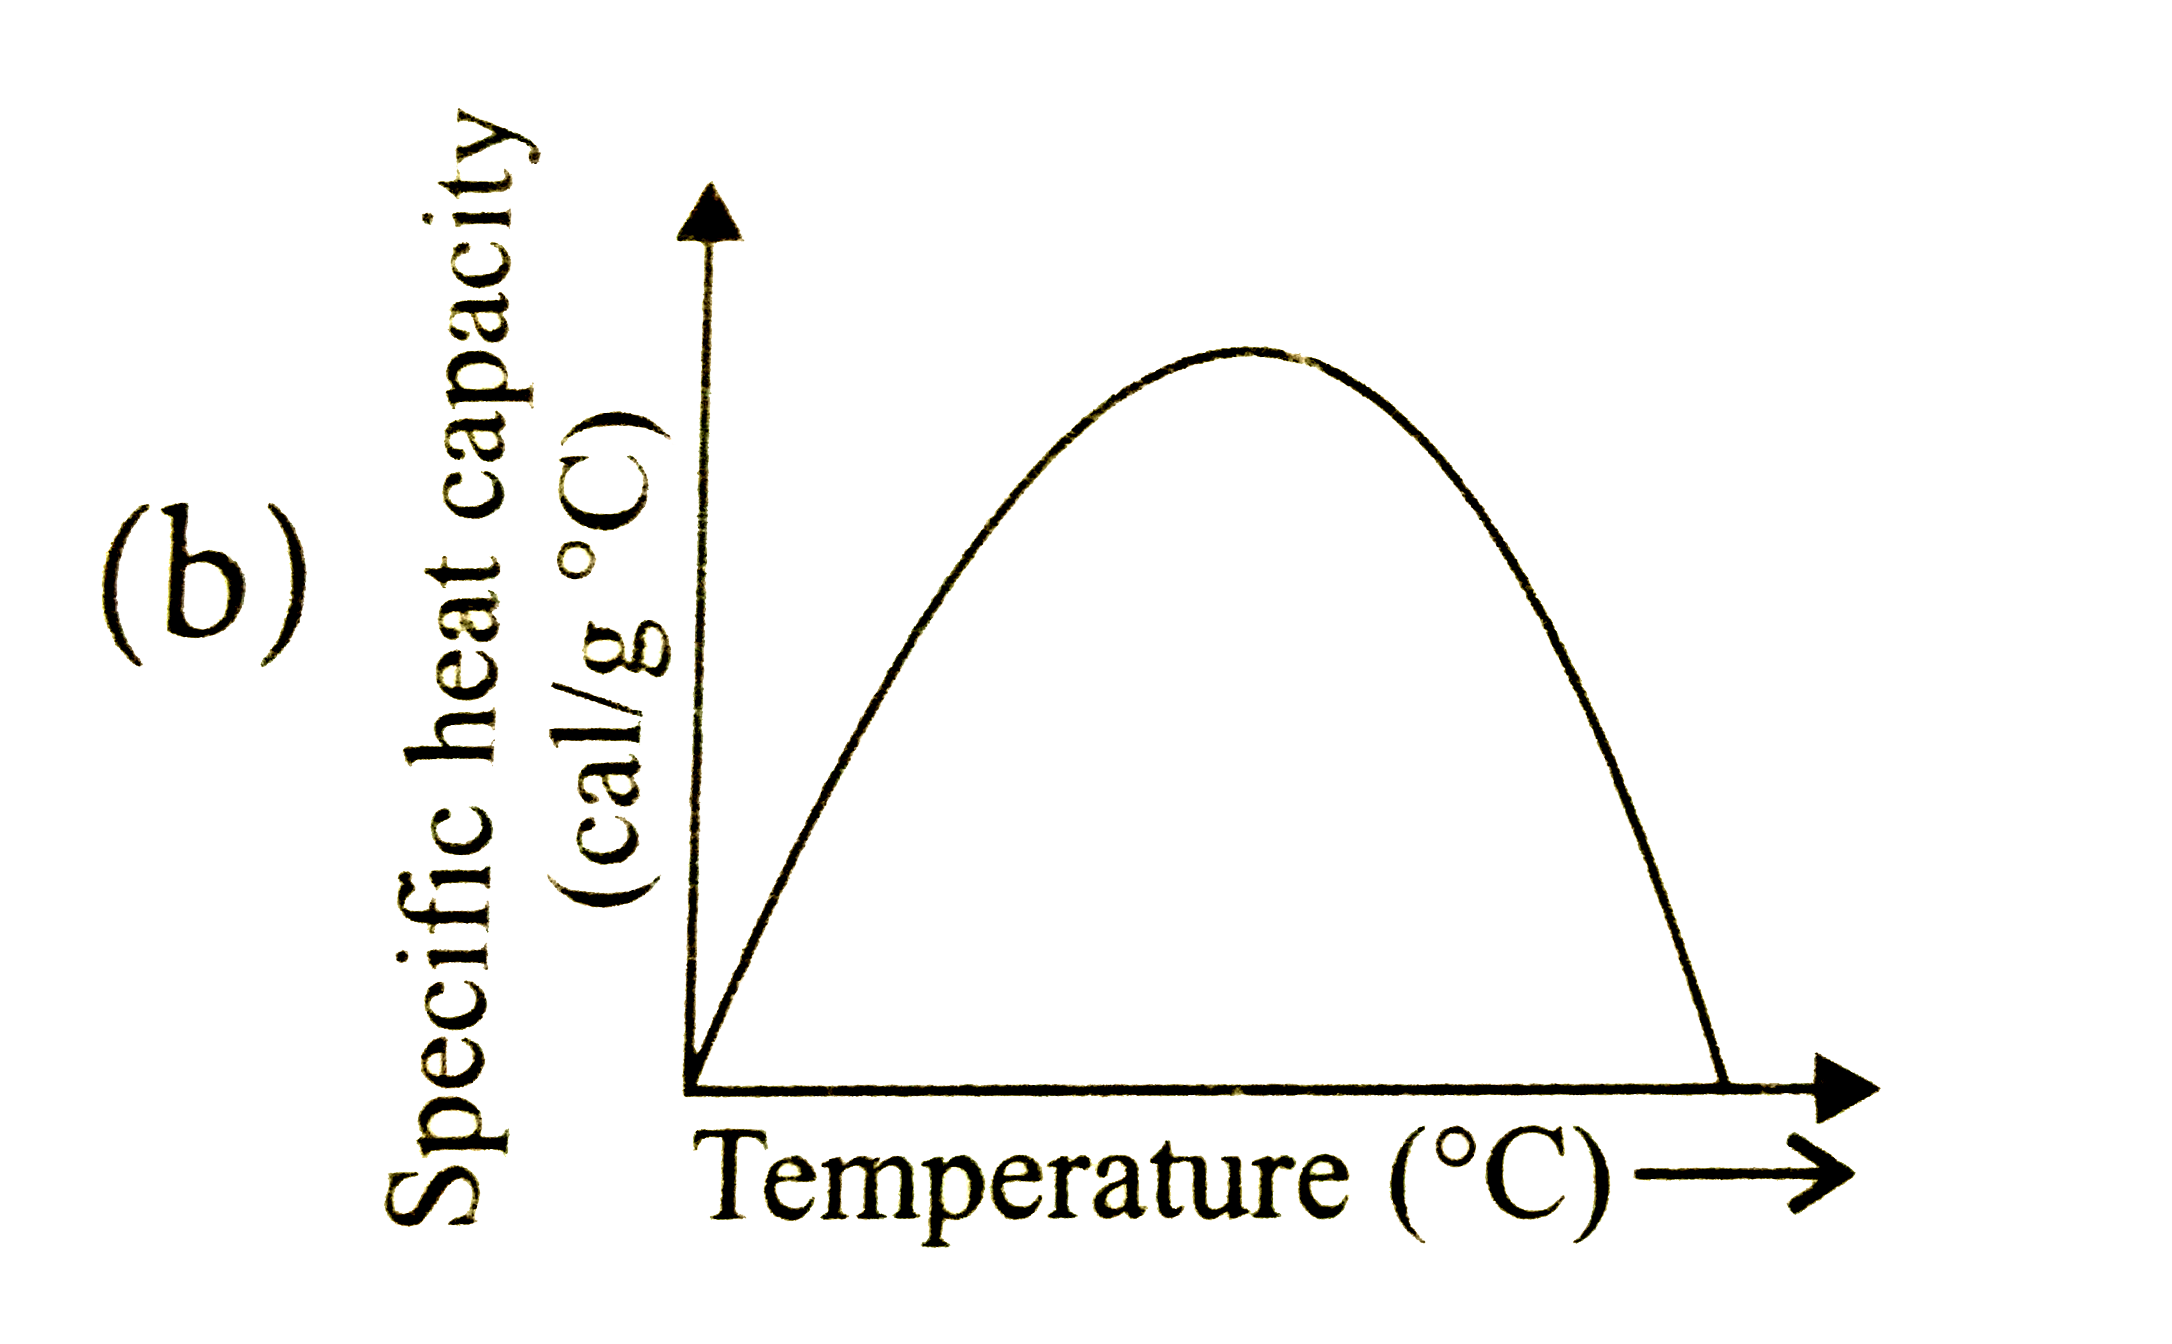
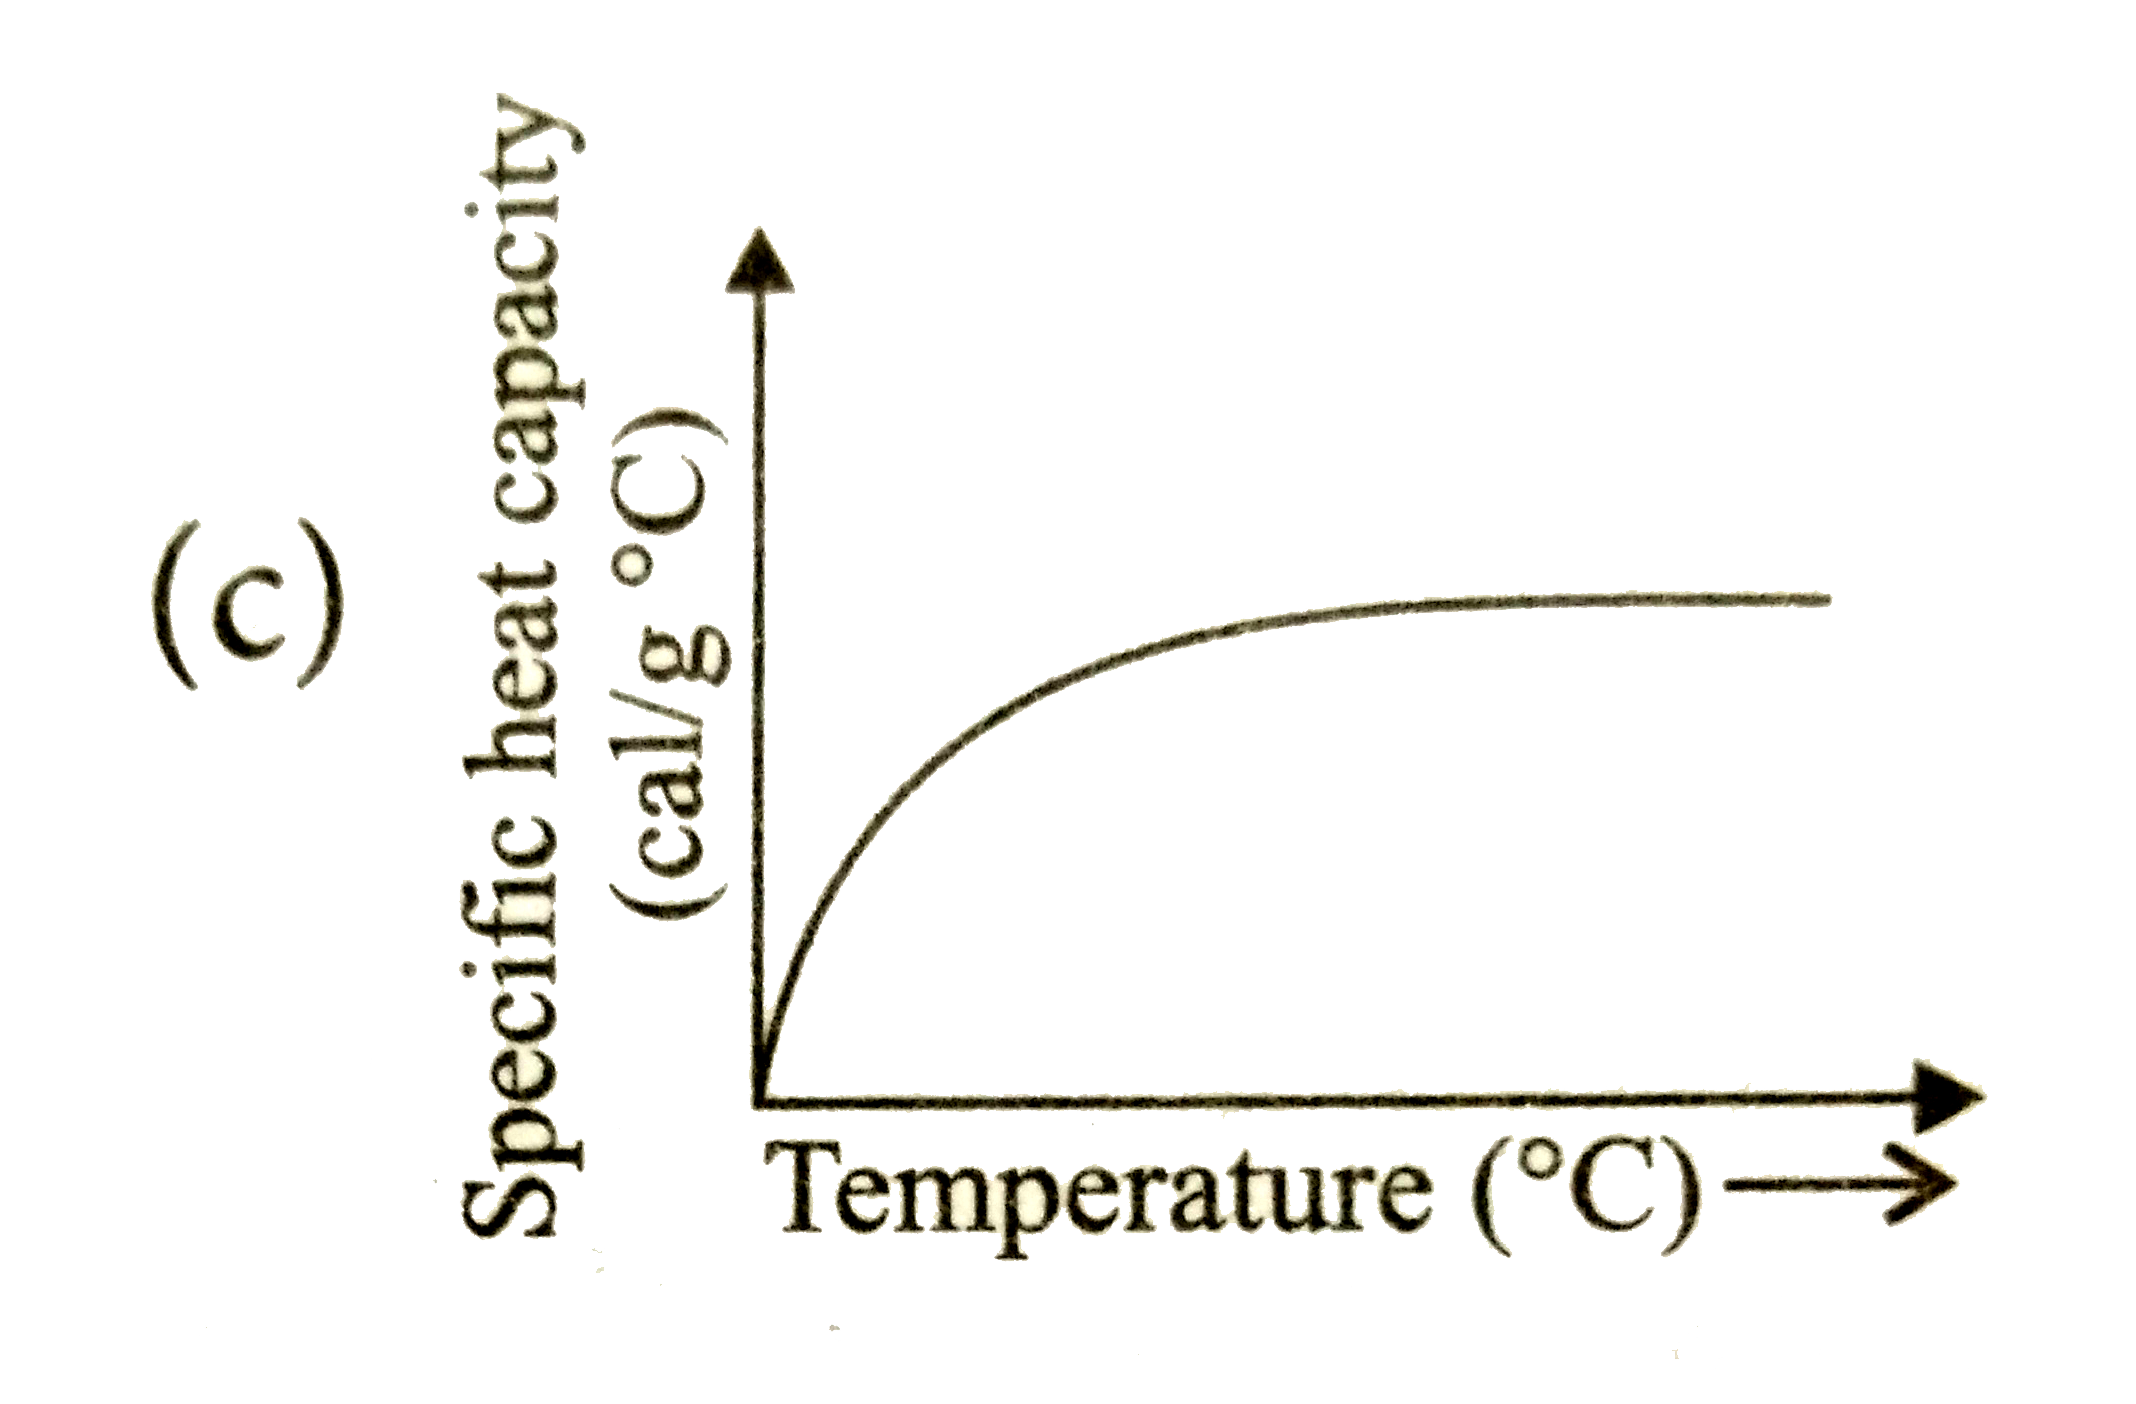
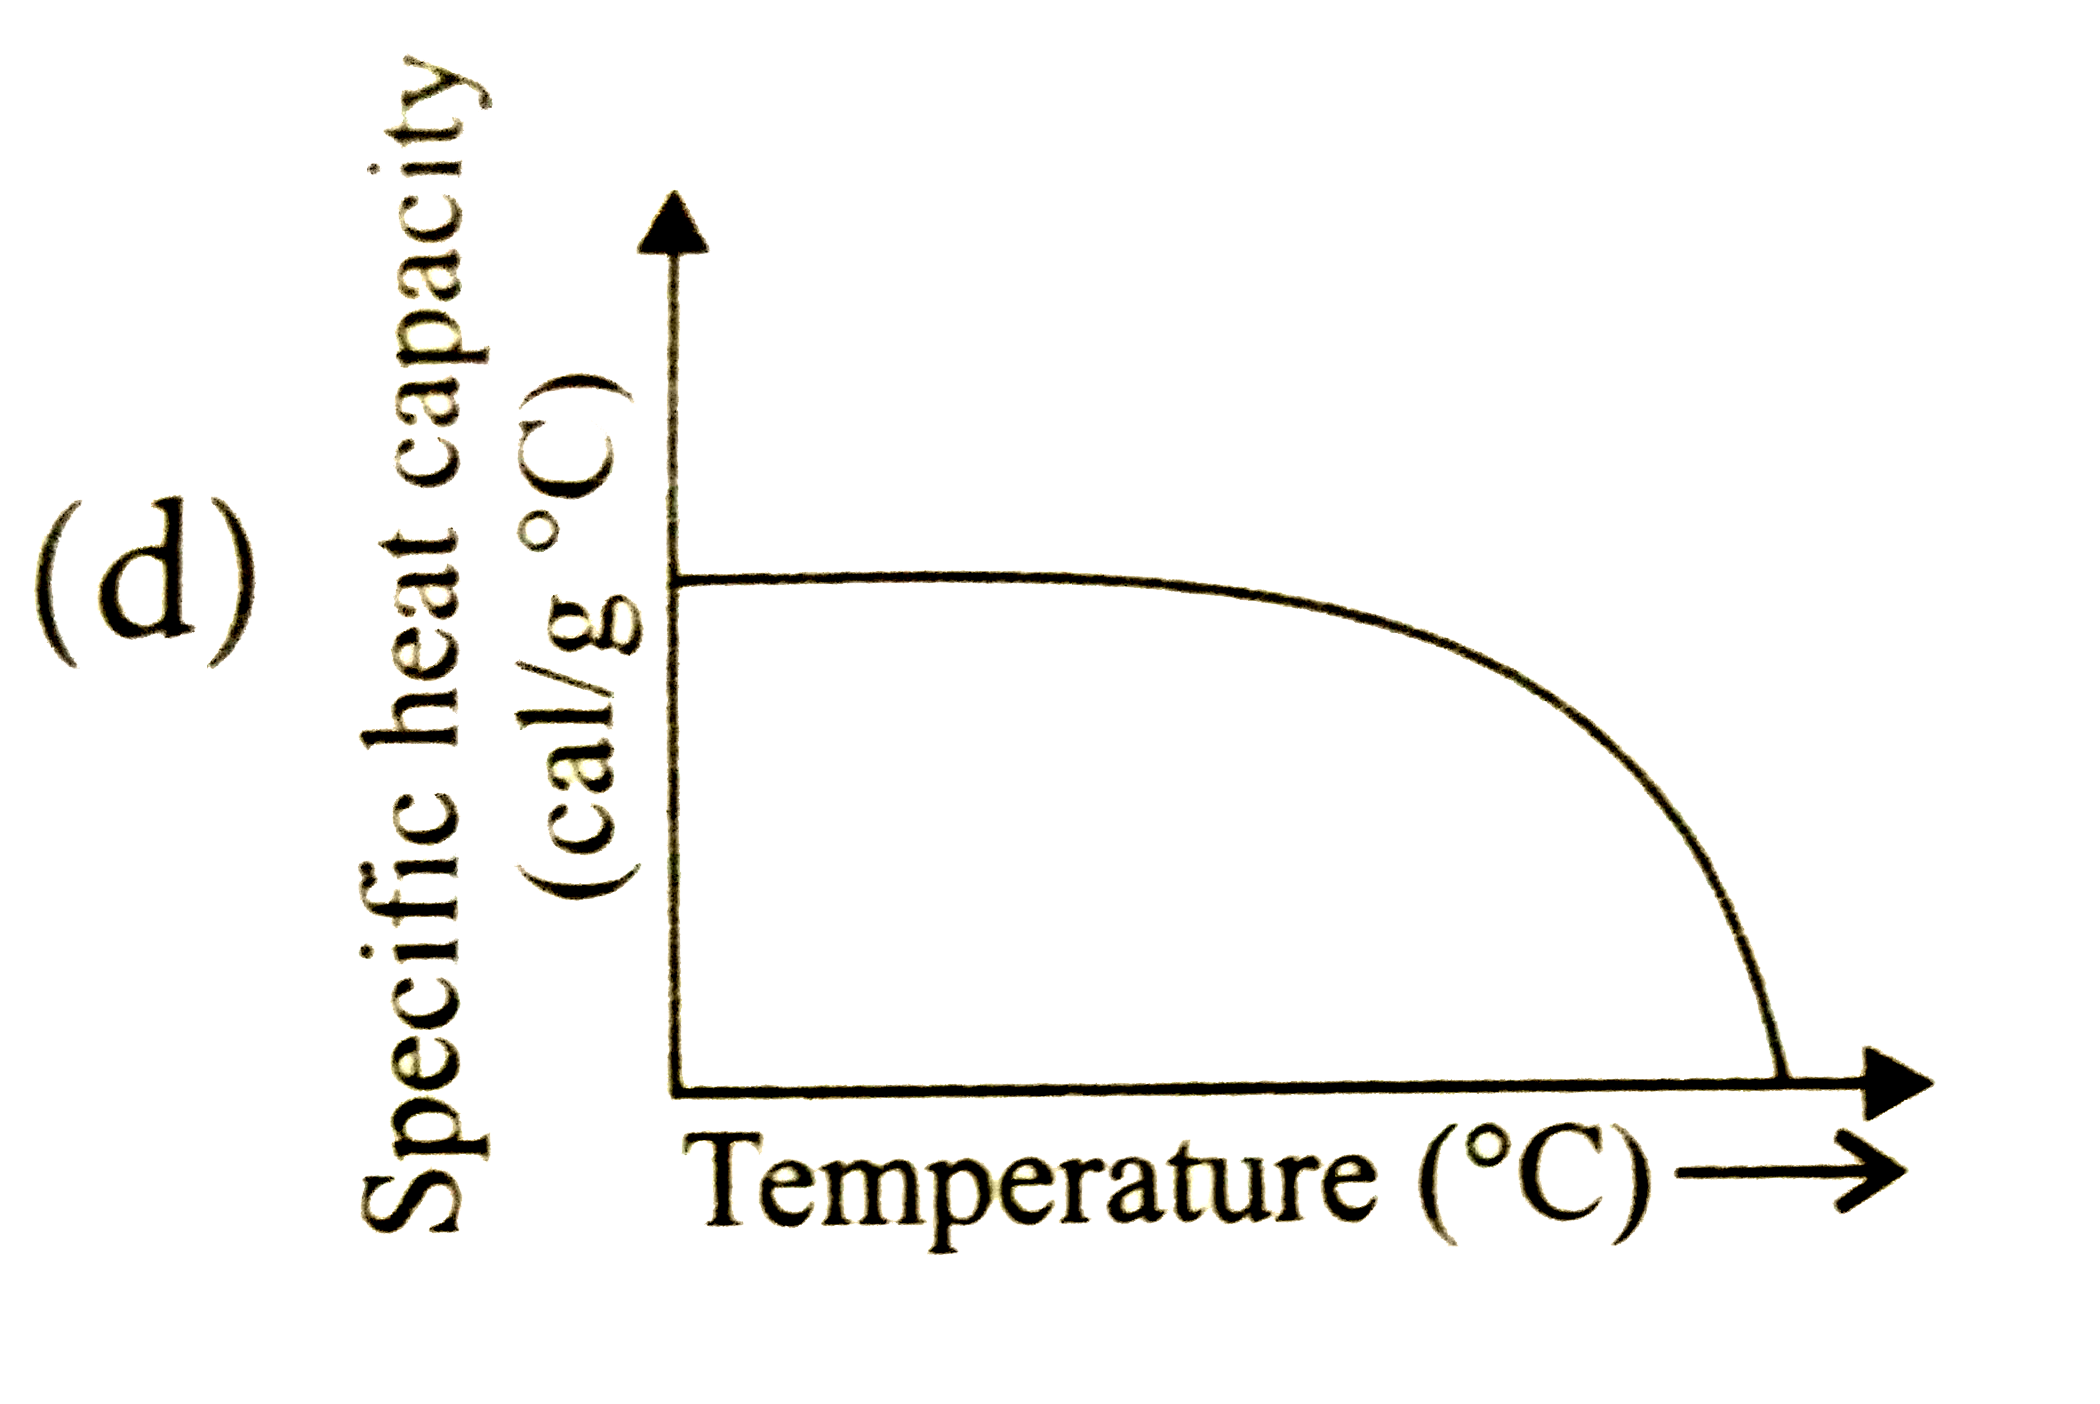
- Which one of the following graphs represents variation of specific hea...
Text Solution
|
- An ideal gas having molar specific heat capaicty at constatnt volume i...
Text Solution
|
- For nitrogen C(p)-C(V)=x and for argon C(P)-C(V)=y.The relation betwee...
Text Solution
|
- Two moles of oxygen are mixed with eight moles of helium. The effectiv...
Text Solution
|
- One mole of an ideal monoatomic gas at temperature T0 expands slowly a...
Text Solution
|
- The amount of heat supplied to 4xx10^(-2) kg of nitrogen at room tempe...
Text Solution
|
- A sample of ideal gas (gamma=1.4) is heated at constant pressure. If a...
Text Solution
|
- What amount of heat must be supplied to 35 g of oxygen at room tempera...
Text Solution
|
- Heat is supplied to a diatomic gas at constant pressure. The ratio o...
Text Solution
|
- Calculate the change in internal energy when 5g of air is heated from ...
Text Solution
|
- If R = universal gas constant, the amount of heat needed to raise the...
Text Solution
|