A
B
C
D
Text Solution
Verified by Experts
The correct Answer is:


Topper's Solved these Questions
THERMODYNAMICS
NCERT FINGERTIPS|Exercise Assertion And Reason|15 VideosTHERMODYNAMICS
NCERT FINGERTIPS|Exercise Higher Order Thinking Skills|8 VideosTHERMAL PROPERTIES OF MATTER
NCERT FINGERTIPS|Exercise Assertion And Reason|10 VideosUNITS AND MEASUREMENTS
NCERT FINGERTIPS|Exercise Assertion And Reason|15 Videos
Similar Questions
Explore conceptually related problems
NCERT FINGERTIPS-THERMODYNAMICS-MCQs
- An ideal gas undergoes for different processes from the same initial s...
Text Solution
|
- If an average jogs, he produces 14.5xx10^(3) cal/min. This is removed ...
Text Solution
|
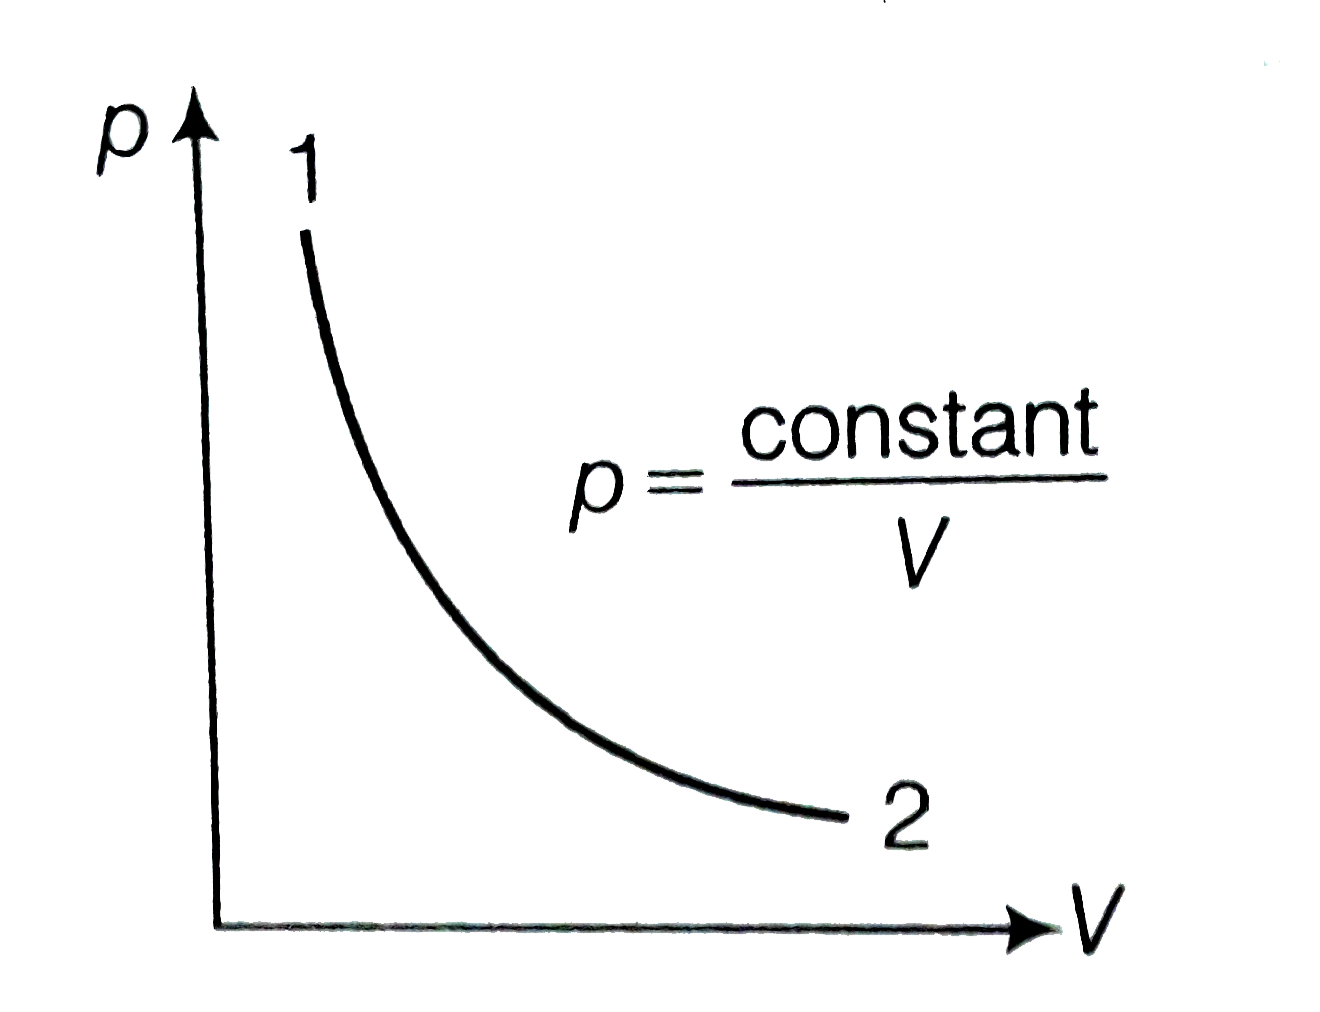
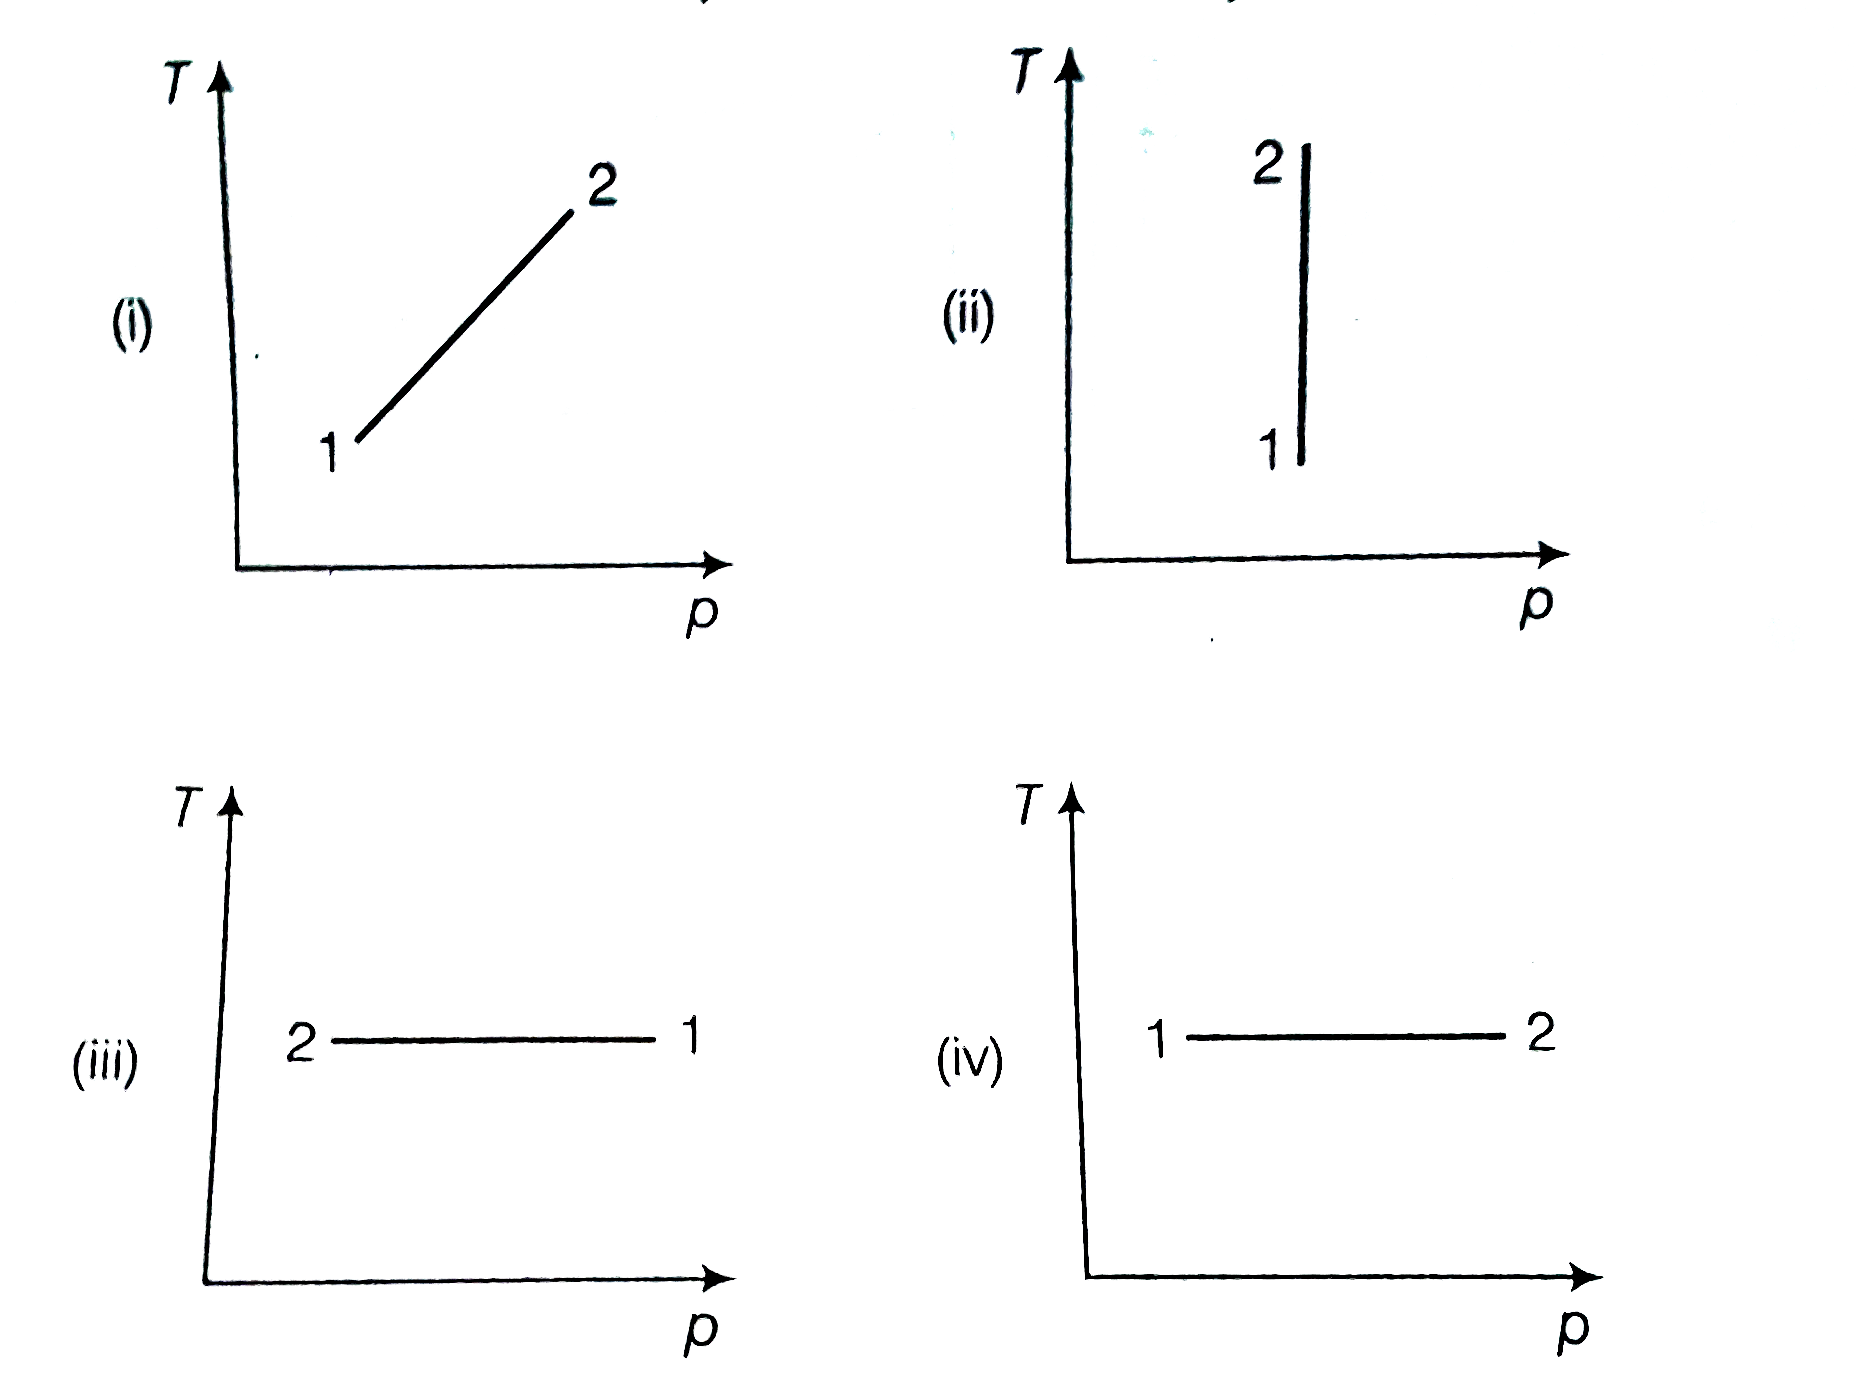
- Consider p-V diagram for an ideal gas shown in figure. Out of the...
Text Solution
|
- An ideal gas undergoes cyclic process ABCDA as shown in givend p-V dia...
Text Solution
|
- Consider two containers A and B containing identical gases at the same...
Text Solution
|
- Three copper blocks of masses M(1), M(2) and M(3) kg respectively are ...
Text Solution
|