Home
Class 12
BIOLOGY
The curve given below shows enzymatic ac...

The curve given below shows enzymatic activity with relation to three conditions (pH, temperature and substrate concentration). What does the two axis (x and y) represent ?

A

`{:("X-axis","Y-axis"),("Temperature","Enzyme activity"):}`

B

`{:("X-axis","Y-axis"),("Enzyme activity",pH):}`

C

`{:("X-axis","Y-axis"),("Enzyme activity","Temperature"):}`

D

More than one option is correct

Text Solution

Verified by Experts

The correct Answer is:
A
Promotional Banner

Topper's Solved these Questions

  • NTA NEET TEST 101

    NTA MOCK TESTS|Exercise BIOLOGY|90 Videos
  • NTA NEET TEST 103

    NTA MOCK TESTS|Exercise BIOLOGY|90 Videos

Similar Questions

Explore conceptually related problems

the curve given below shows wnzymatic acitvity with relation to three conditions (pH , temperature and substrate concentration ). what do the two axes ( x and y) represent ?

The graph given below represents the organisms reponse to temperature as an environmental conditions : (i) Which one of the two lines represents conformers and why ? (ii) What does the other line in the graph represent and why ? (b) Mention the different adaptations the parasites have evolved with , to be able to successfuly complete their life cycle in their hosts.

(a) The graph given below represents the organisms response to temperature as an environmental condition. (i) Which one of the two lines represents conformers and why ? (ii) What does the other line in the graph represent and why ? (b) Mention the different adaptations the parasites have evolved with, to be able to successfully complete their life cycles in their hosts.

Figure given below shows three velocity-substrate concentration curves for an enzyme reaxtion. What do the curves for an enzyme reaction. What do the curves depict

The Given figure shows three velocity-substrate concentration curves of an enzyme reaction. What do the curves X Y and Z depict respectively ?

The graph given below shows the effect of substrate concentration on the rate of reaction of the enzyme green-gram-phosphatase What does the graph indicates?

The given graph shows the effect of substrate concentration on the rate of reaction of the enzymes green gram-phosphatase. What does the graph indicate ?

NTA MOCK TESTS-NTA NEET TEST 102-BIOLOGY
  1. The extinct human who lived 100000 to 40000 years ago, in Europe, Aisa...

    Text Solution

    |

  2. Read the following four statements (A-D) A. The first transgenic buf...

    Text Solution

    |

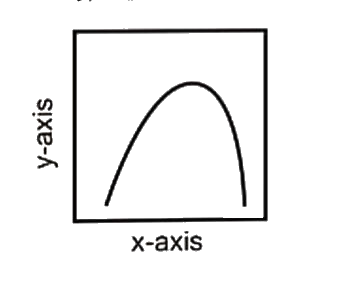
  3. The curve given below shows enzymatic activity with relation to three ...

    Text Solution

    |

  4. In RNA interference (RNAi) :

    Text Solution

    |

  5. Match column - I with column - II and select the CORRECT option form t...

    Text Solution

    |

  6. In Amoeba , encystation is

    Text Solution

    |

  7. 2-celled pollen grains of angiosperm represents:

    Text Solution

    |

  8. If four o' clock plants, the gene for red flower colour (R) is inc...

    Text Solution

    |

  9. In eukaryotes , the process of DNA replication is :

    Text Solution

    |

  10. Resistance to jassids in cotton and cereal leaf beetles in wheat is du...

    Text Solution

    |

  11. Alexander Fleming while working on ………..bacteria , observed Penicilliu...

    Text Solution

    |

  12. In the absence of an external source of water, the kangaroo rot in Nor...

    Text Solution

    |

  13. Which of the following is CORRECTLY matched ?

    Text Solution

    |

  14. Deserts, rain forests, mangroves, coral reefs, wetlands, estuaries and...

    Text Solution

    |

  15. The aromatic polyurethane elastomeric polymer and used along with bitu...

    Text Solution

    |

  16. The coconut water from tender coconut represents

    Text Solution

    |

  17. Which of the following characters was not chosen by Mendel ?

    Text Solution

    |

  18. Select the correct statement for transcription.

    Text Solution

    |

  19. The effluent from the ………..treatment plant is generally released into ...

    Text Solution

    |

  20. When population reaches carrying capacity :

    Text Solution

    |