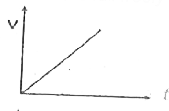
A
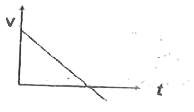
B
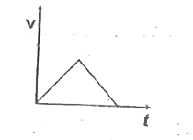
C
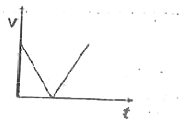
D
Text Solution
Verified by Experts
The correct Answer is:


Topper's Solved these Questions
Similar Questions
Explore conceptually related problems
FIITJEE-KINEMATICS-Problem (objective)
- With what minimum speed must a particle be projected from origin so th...
Text Solution
|
- A car is moving eastward with velocity 10 m/s. In 20 sec, the velocit...
Text Solution
|
- Choose the wrong statement.
Text Solution
|
- A motor boat is to reach to a point 30^(@) upstream on other side of a...
Text Solution
|
- Which of the following graph correctly represents velocity-time relati...
Text Solution
|
- v34
Text Solution
|
- For a particle moving on a curved path kinectic energy is given as k...
Text Solution
|
- In a river , a boat with a vertical pole on it is moving and velocity ...
Text Solution
|
- A particle start at t=0 from origin alongs x axis and its velcoity is ...
Text Solution
|
- Ring is fixed on the horizontal surface and a rod starts rotatiing wit...
Text Solution
|
- A point moves such that its displacement as a function of times is giv...
Text Solution
|
- The velocity of a particle along a straight line increases according t...
Text Solution
|
- A cart is moving alongs +ve x-direction with a speed of 4m/s Aperson ...
Text Solution
|
- Acceleration of a particle which is at rest at x=0 is vec a = (4 -2...
Text Solution
|