


Similar Questions
Explore conceptually related problems
Recommended Questions
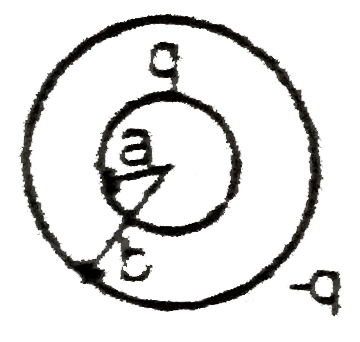
- Figure shows two concentric shells of radii a and b uniformly distribu...
Text Solution
|
- A charge Q is uniformly distributed in a dielectric sphere of radius R...
Text Solution
|
- Two concentric conducting shells of radius a and (gt a) carry charges ...
Text Solution
|
- Figure shows two concentric shells of radii a and b uniformly distribu...
Text Solution
|
- A spherical insulator of radius R is charged uniformly with a charge Q...
Text Solution
|
- Two concentric spherical shells of radii R and 2R have charges Q and 2...
Text Solution
|
- A ring shaped conductor with radius a carries a net positive charge q ...
Text Solution
|
- A spherical insulator of radius R is charged uniformly with a charge Q...
Text Solution
|
- A metallic spherical shell of radius R has a charge -Q on it. A point ...
Text Solution
|