


Topper's Solved these Questions
STATISTICS
CBSE COMPLEMENTARY MATERIAL|Exercise Long Answer Type Questions|9 VideosSTATISTICS
CBSE COMPLEMENTARY MATERIAL|Exercise Practice -Test|5 VideosSTATISTICS
CBSE COMPLEMENTARY MATERIAL|Exercise Short Answer Type Question (I)|9 VideosSOME APPLICATIONS OF TRIGONOMETRY
CBSE COMPLEMENTARY MATERIAL|Exercise PRACTICE-TEST (SECTION-D)|1 VideosSURFACE AREA AND VOLUME
CBSE COMPLEMENTARY MATERIAL|Exercise PRACTICE TEST ( SECTION-D)|1 Videos
Similar Questions
Explore conceptually related problems
CBSE COMPLEMENTARY MATERIAL-STATISTICS-Short Answer Type Question (II)
- If the mean of the following distribution is 54, find the value of P.
Text Solution
|
- Find the median of the following distribution
Text Solution
|
- The median of following frequency distribution is 24 years. Find the m...
Text Solution
|
- Find the median of the following data
Text Solution
|
- Find the mode of the following data.
Text Solution
|
- The following table represent marks obtained by 100 students in a test...
Text Solution
|
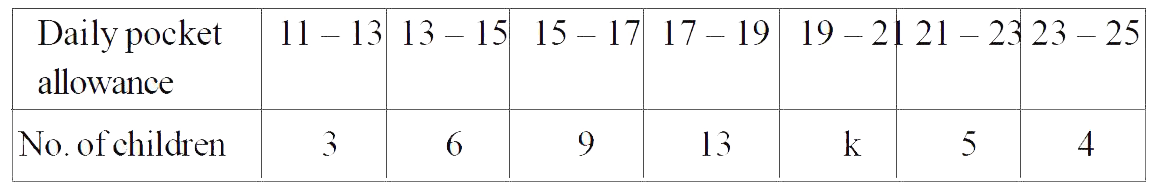
- The following table represent pocket allowance of children of a colony...
Text Solution
|
- Find mode of the following frequency distribution. The mean of ab...
Text Solution
|