


Similar Questions
Explore conceptually related problems
Recommended Questions
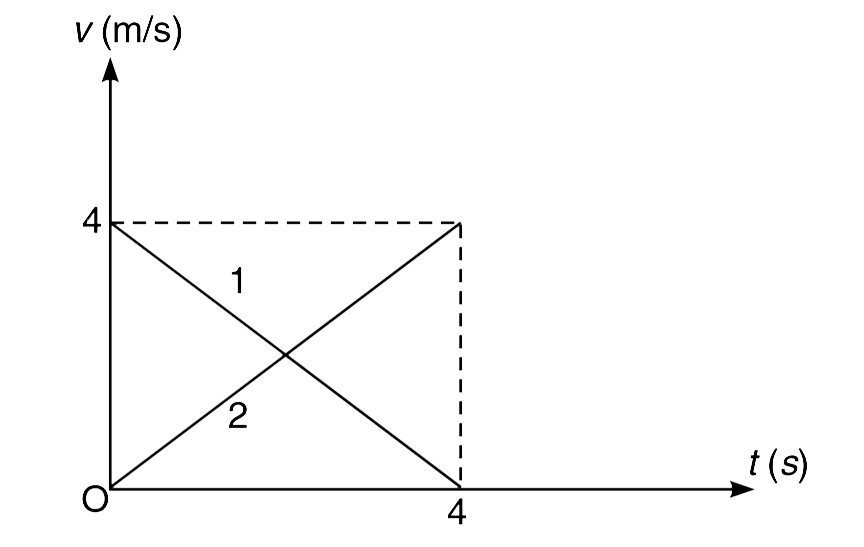
- The velocity time graph for two particles (1 and 2) moving along X axi...
Text Solution
|
- Particles A and B are moving with constant velocities along x and y ax...
Text Solution
|
- The velocity time graph for two particles (1 and 2) moving along X axi...
Text Solution
|
- Velocity time graphs of particles A and B moving along x-axis are show...
Text Solution
|
- Two particles A and B start from the origin along x-axis. Velocity tim...
Text Solution
|
- Suppose that at time t ul( gt)0 the position of a particle moving on t...
Text Solution
|
- A particle starts from the origin at time t = 0 and moves along the po...
Text Solution
|
- The velocity-time graph is given below Draw the acceleration-time...
Text Solution
|
- Draw the acceleration-time graphs for the given velocity-time graphs o...
Text Solution
|