


Similar Questions
Explore conceptually related problems
Recommended Questions
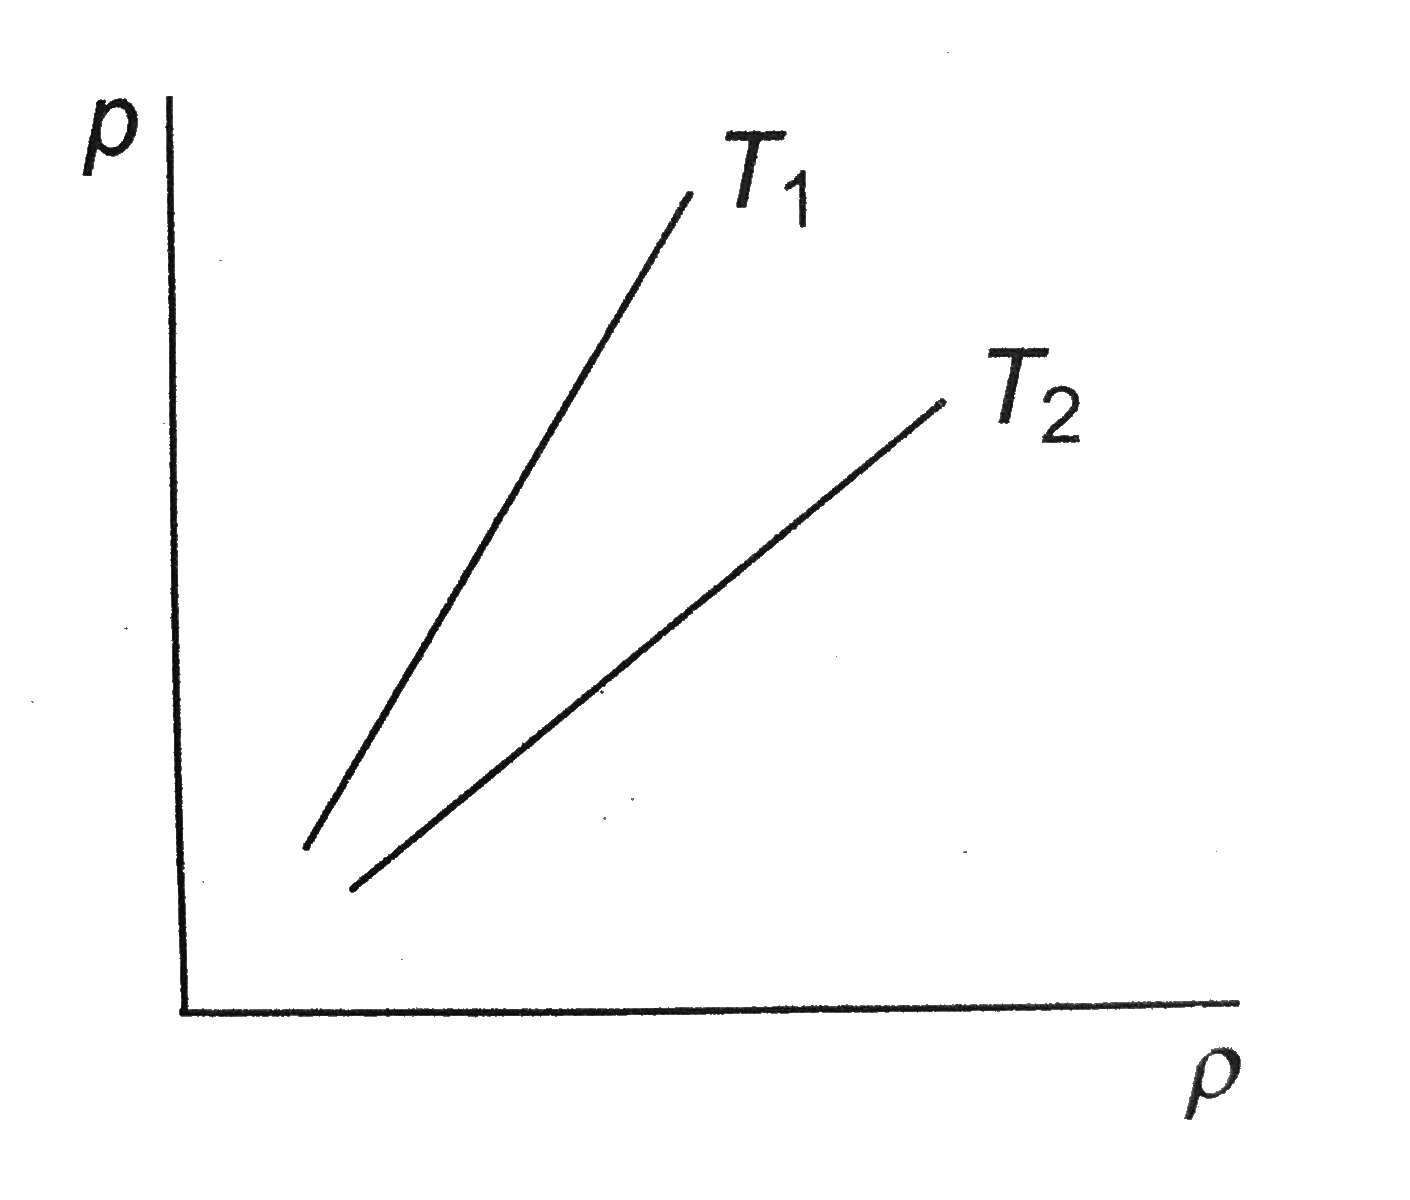
- Figure shows graphs of pressure vs density for an ideal gas at two tem...
Text Solution
|
- Shows graphs of pressure vs density for an ideal gas at two temperatur...
Text Solution
|
- Figure shows the pressure P versus volume V graphs for a certains mass...
Text Solution
|
- Figure shows graphs of pressure vs density for an ideal gas at two tem...
Text Solution
|
- Figure shows graphs of pressure versus density for an ideal gas at two...
Text Solution
|
- The adjoining fgure shows graph of pressure and volume of a gas at two...
Text Solution
|
- Figure shows graphs of pressure vs density for an ideal gas at two tem...
Text Solution
|
- Figure shows graphs of pressure vs density for an ideal gas at two tem...
Text Solution
|
- Figure shows the isotherms of fixed mass of an ideal gas at three temp...
Text Solution
|