


Similar Questions
Explore conceptually related problems
Recommended Questions
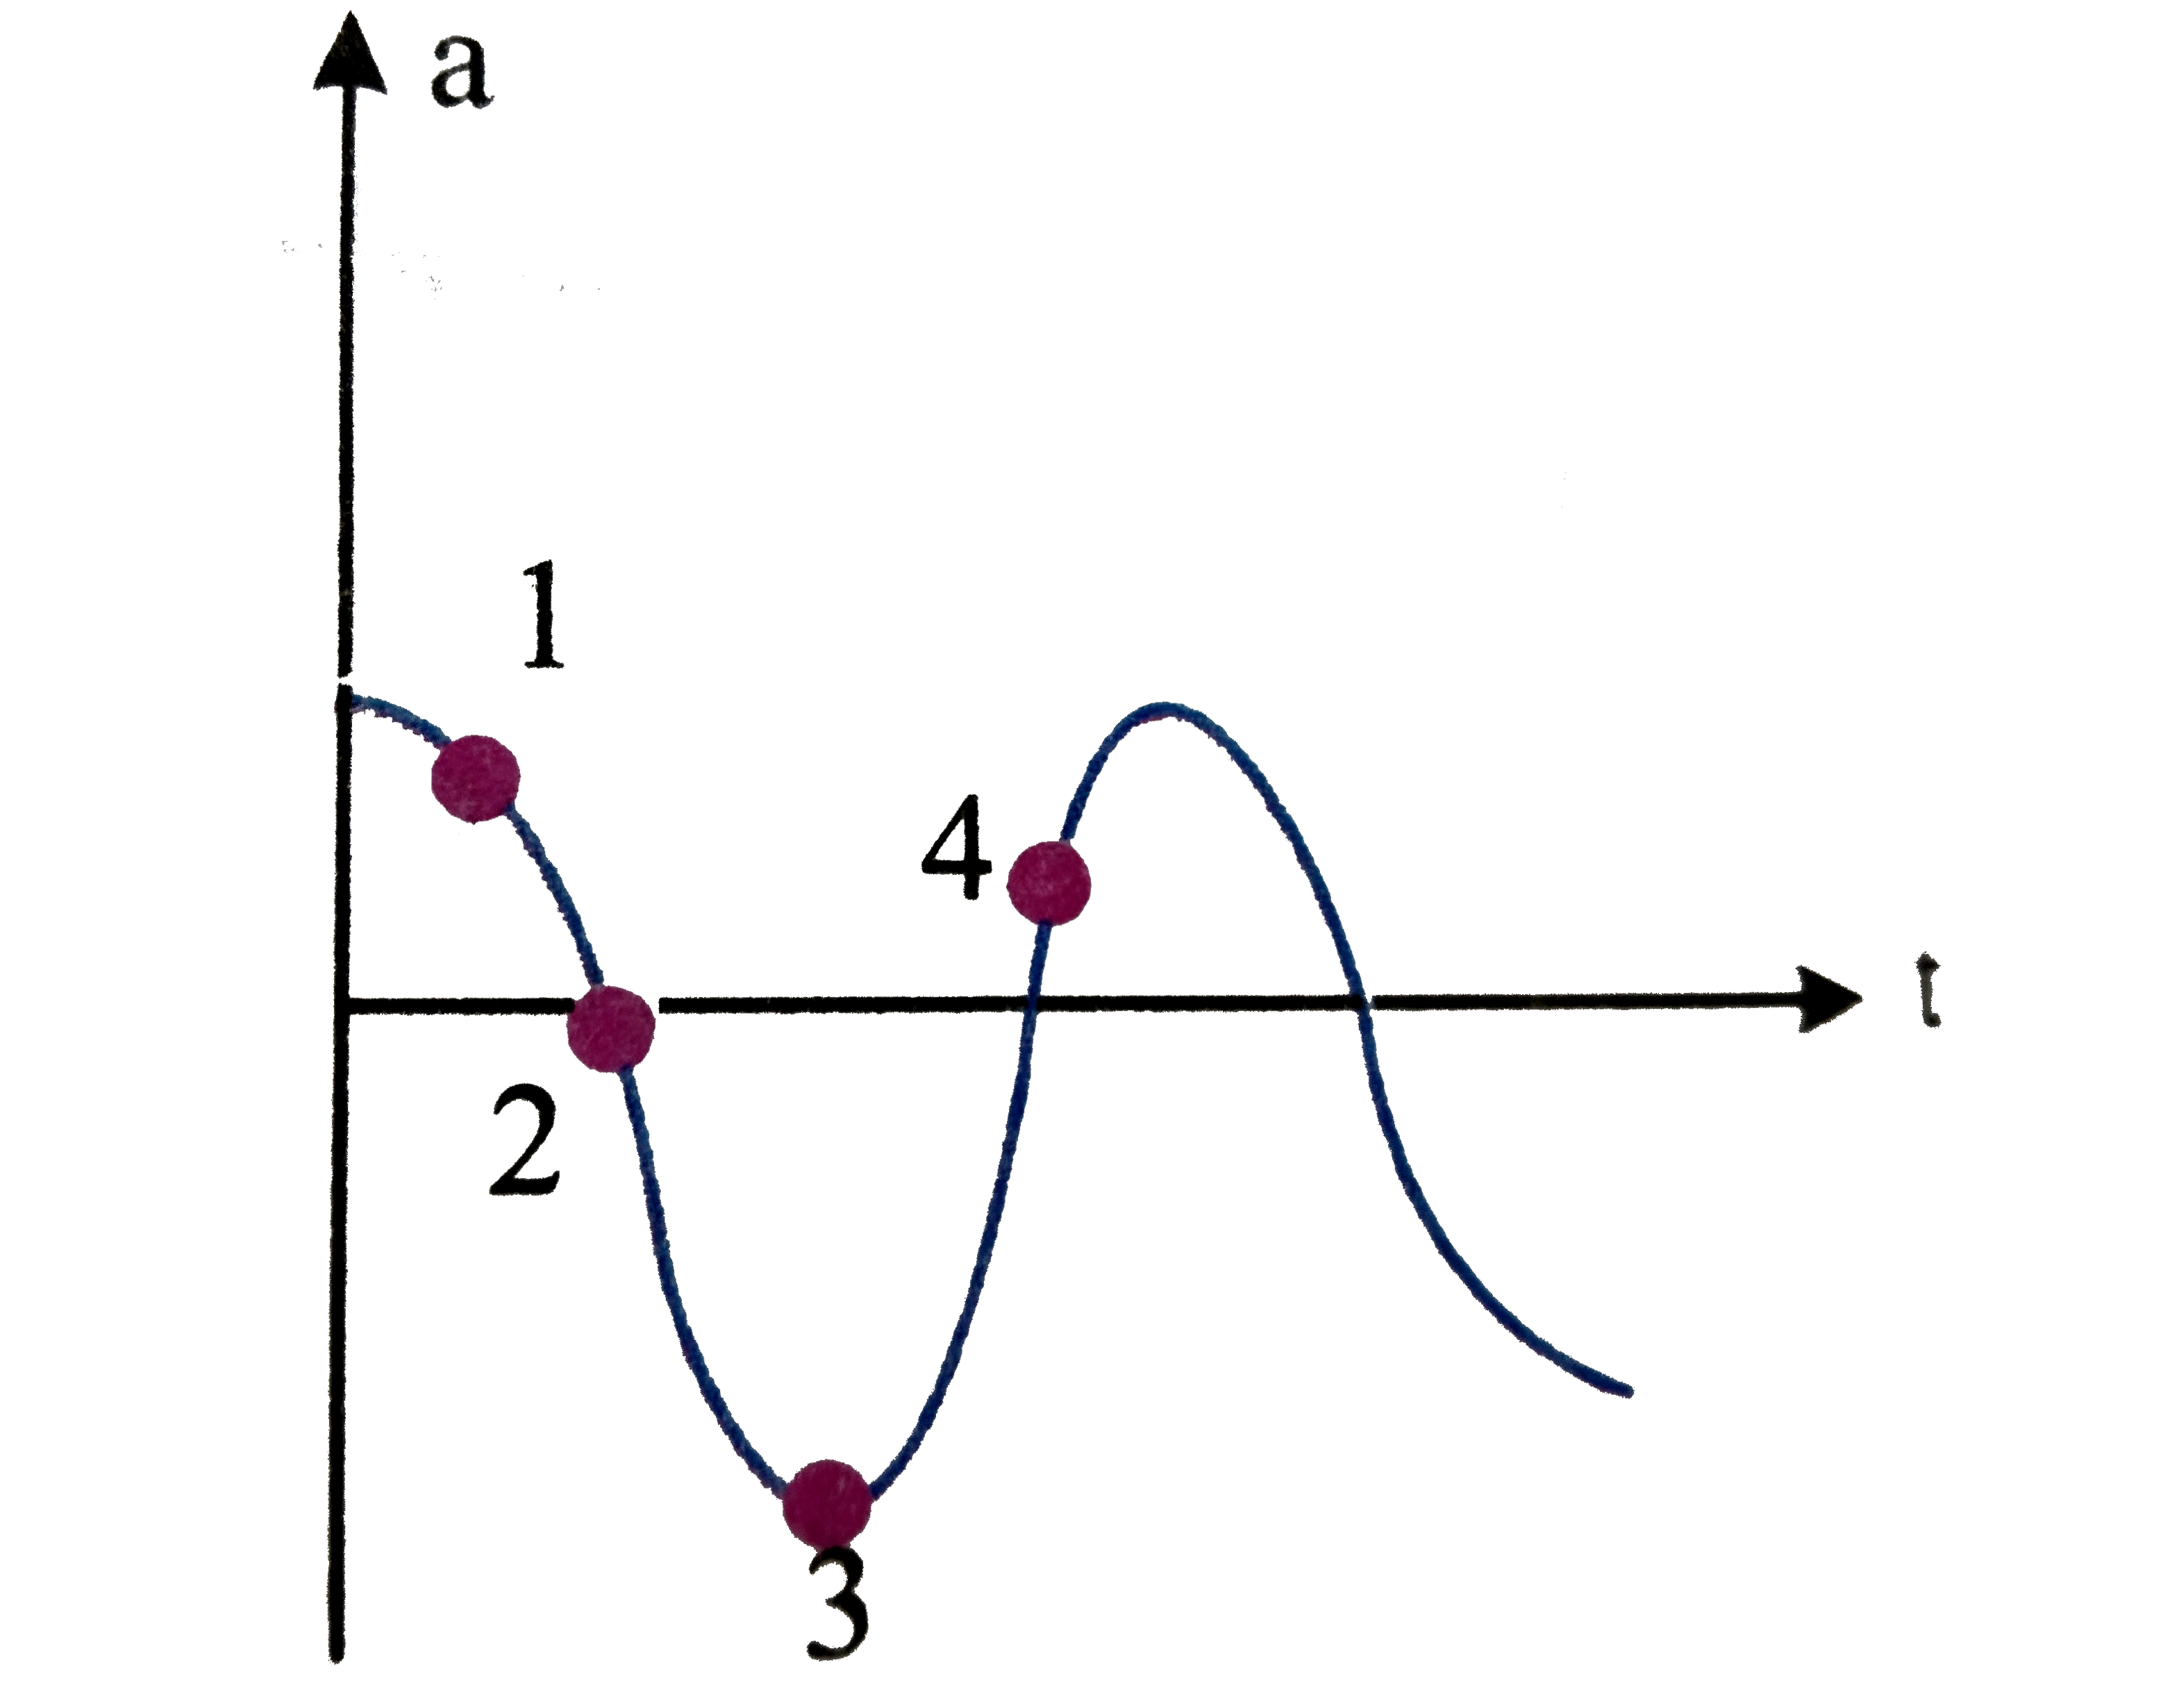
- Acceleration -time graph of a particel executing SHM is as shown in fi...
Text Solution
|
- Two particels (A) and (B) are in motion . If the wavelngth wavelength ...
Text Solution
|
- What is the ratio betweenthe potential energy and the total energy of ...
Text Solution
|
- What is the angle between particel velocity and wave velocity in (i) t...
Text Solution
|
- Particel A having positive charfes is moving directly head -on to ward...
Text Solution
|
- The figure shows a velocity-time graph of a particle moving along a st...
Text Solution
|
- Mass sepctrometers are instruments that measure (i) the charge-to ma...
Text Solution
|
- Velocity -time graph of a particle executing SHM is as shown in fig. S...
Text Solution
|
- Acceleration -time graph of a particel executing SHM is as shown in fi...
Text Solution
|