


Similar Questions
Explore conceptually related problems
Recommended Questions
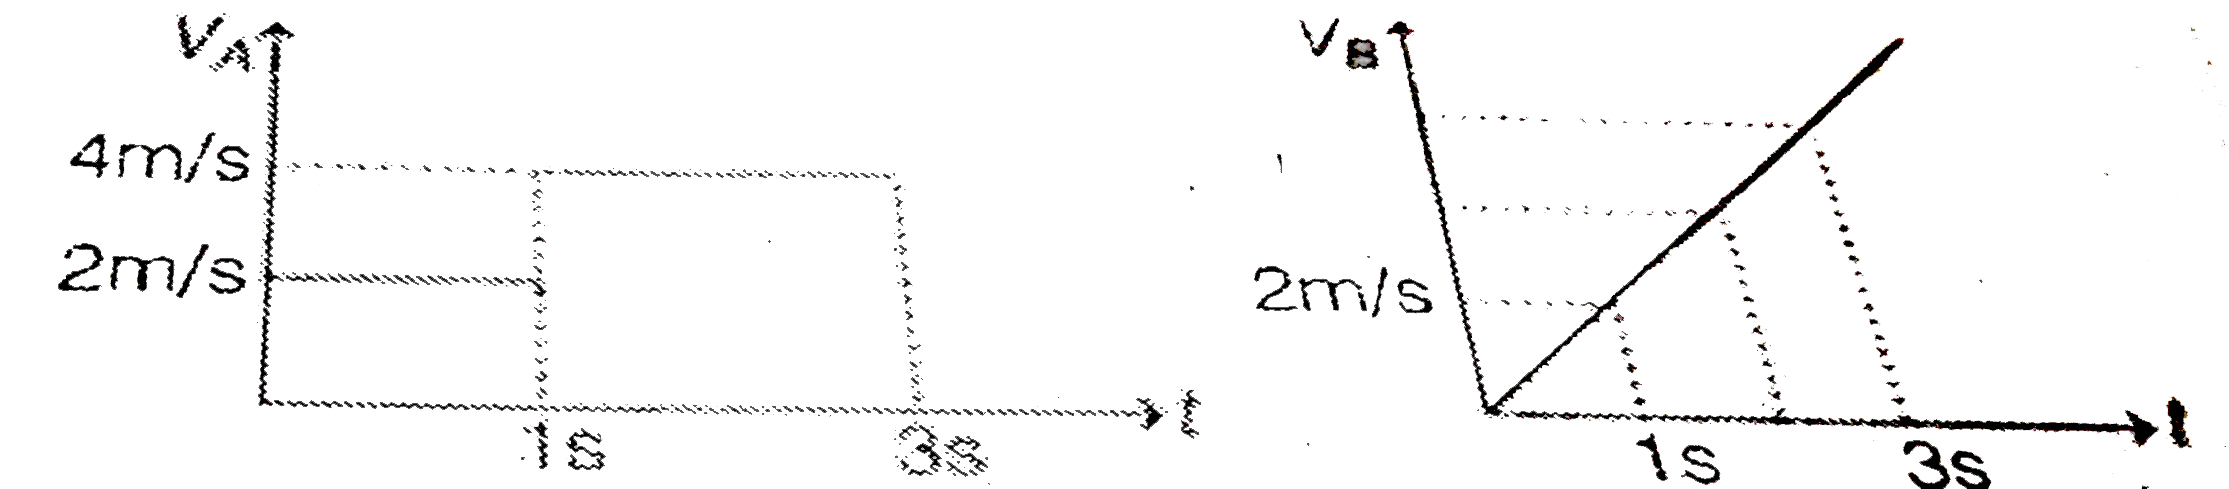
- Two particles A and B start from the origin along x-axis. Velocity tim...
Text Solution
|
- The velocity-time graph of a particle in straight line motion is veloi...
Text Solution
|
- Particles A and B are moving with constant velocities along x and y ax...
Text Solution
|
- A particle starts to move along a straight line. The acceleration vers...
Text Solution
|
- The velocity time graph for two particles (1 and 2) moving along X axi...
Text Solution
|
- Velocity time graphs of particles A and B moving along x-axis are show...
Text Solution
|
- Two particles A and B start from the origin along x-axis. Velocity tim...
Text Solution
|
- The velocity-time graph for a particle moving along X-axis is shown in...
Text Solution
|
- A particle starts from rest x = - 2.25 m and moves along the x - axis ...
Text Solution
|