A
B
C
D
Text Solution
Verified by Experts
The correct Answer is:


Topper's Solved these Questions
Similar Questions
Explore conceptually related problems
JEE MAINS PREVIOUS YEAR-JEE MAIN-All Questions
- Two infinitely large charged planes having uniform surface change dens...
Text Solution
|
- Gravitational field intensity is given by E = Ax/((A^2 + x^2)^(3/2)) t...
Text Solution
|
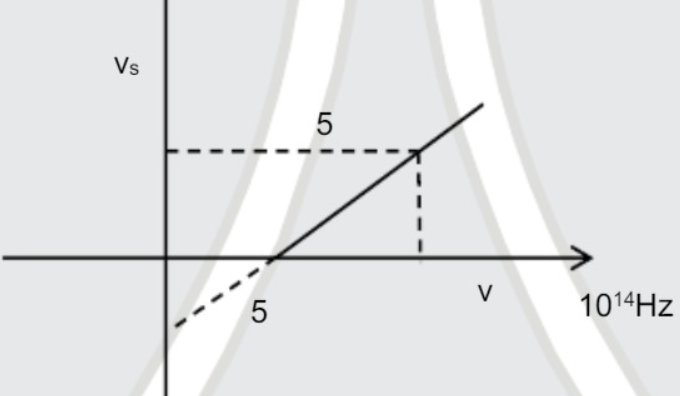
- Graph between stopping potential and frequency of light as shown find ...
Text Solution
|
- Terminal voltage of cell (emf = 3V & internal resistance = r) is equal...
Text Solution
|
- A particle at origin (0,0) moving with initial velocity u = 5 m/s hatj...
Text Solution
|
- Distance between trough and crest of waves is 1.5m while distance betw...
Text Solution
|
- Intensity of plane polarized light is 3.3 W/m. Area of plane 3 x 10^(-...
Text Solution
|
- In compound microscope final image formed at 25 cm from eyepiece lens....
Text Solution
|
- 0.1 mole of gas at 200K is mixed with 0.05 mole of same gas at 400K. I...
Text Solution
|
- Correct graph of voltage across zener diode will be
Text Solution
|
- A bar magnet moves with constant velocity as shown in figure through a...
Text Solution
|
- Two disc made of same material and same thickness having radius R and ...
Text Solution
|
- Bus moving with speed v forwards a stationary wall. it produces sound ...
Text Solution
|
- The given circuit behaves like a following single gate
Text Solution
|
- In the given circuit calculate the potential difference points A and B...
Text Solution
|
- Find current through 4 ohm resistance
Text Solution
|
- Force on a particle varies with position (x) of particle as shown, cal...
Text Solution
|
- A capacitor of capacitance C0 is charged to potential V0. Now it is co...
Text Solution
|
- Find the ratio of moment of inertia about axis perpendicular to rectan...
Text Solution
|
- Find the loss in gravitational potential energy of cylinder when value...
Text Solution
|