


Similar Questions
Explore conceptually related problems
Recommended Questions
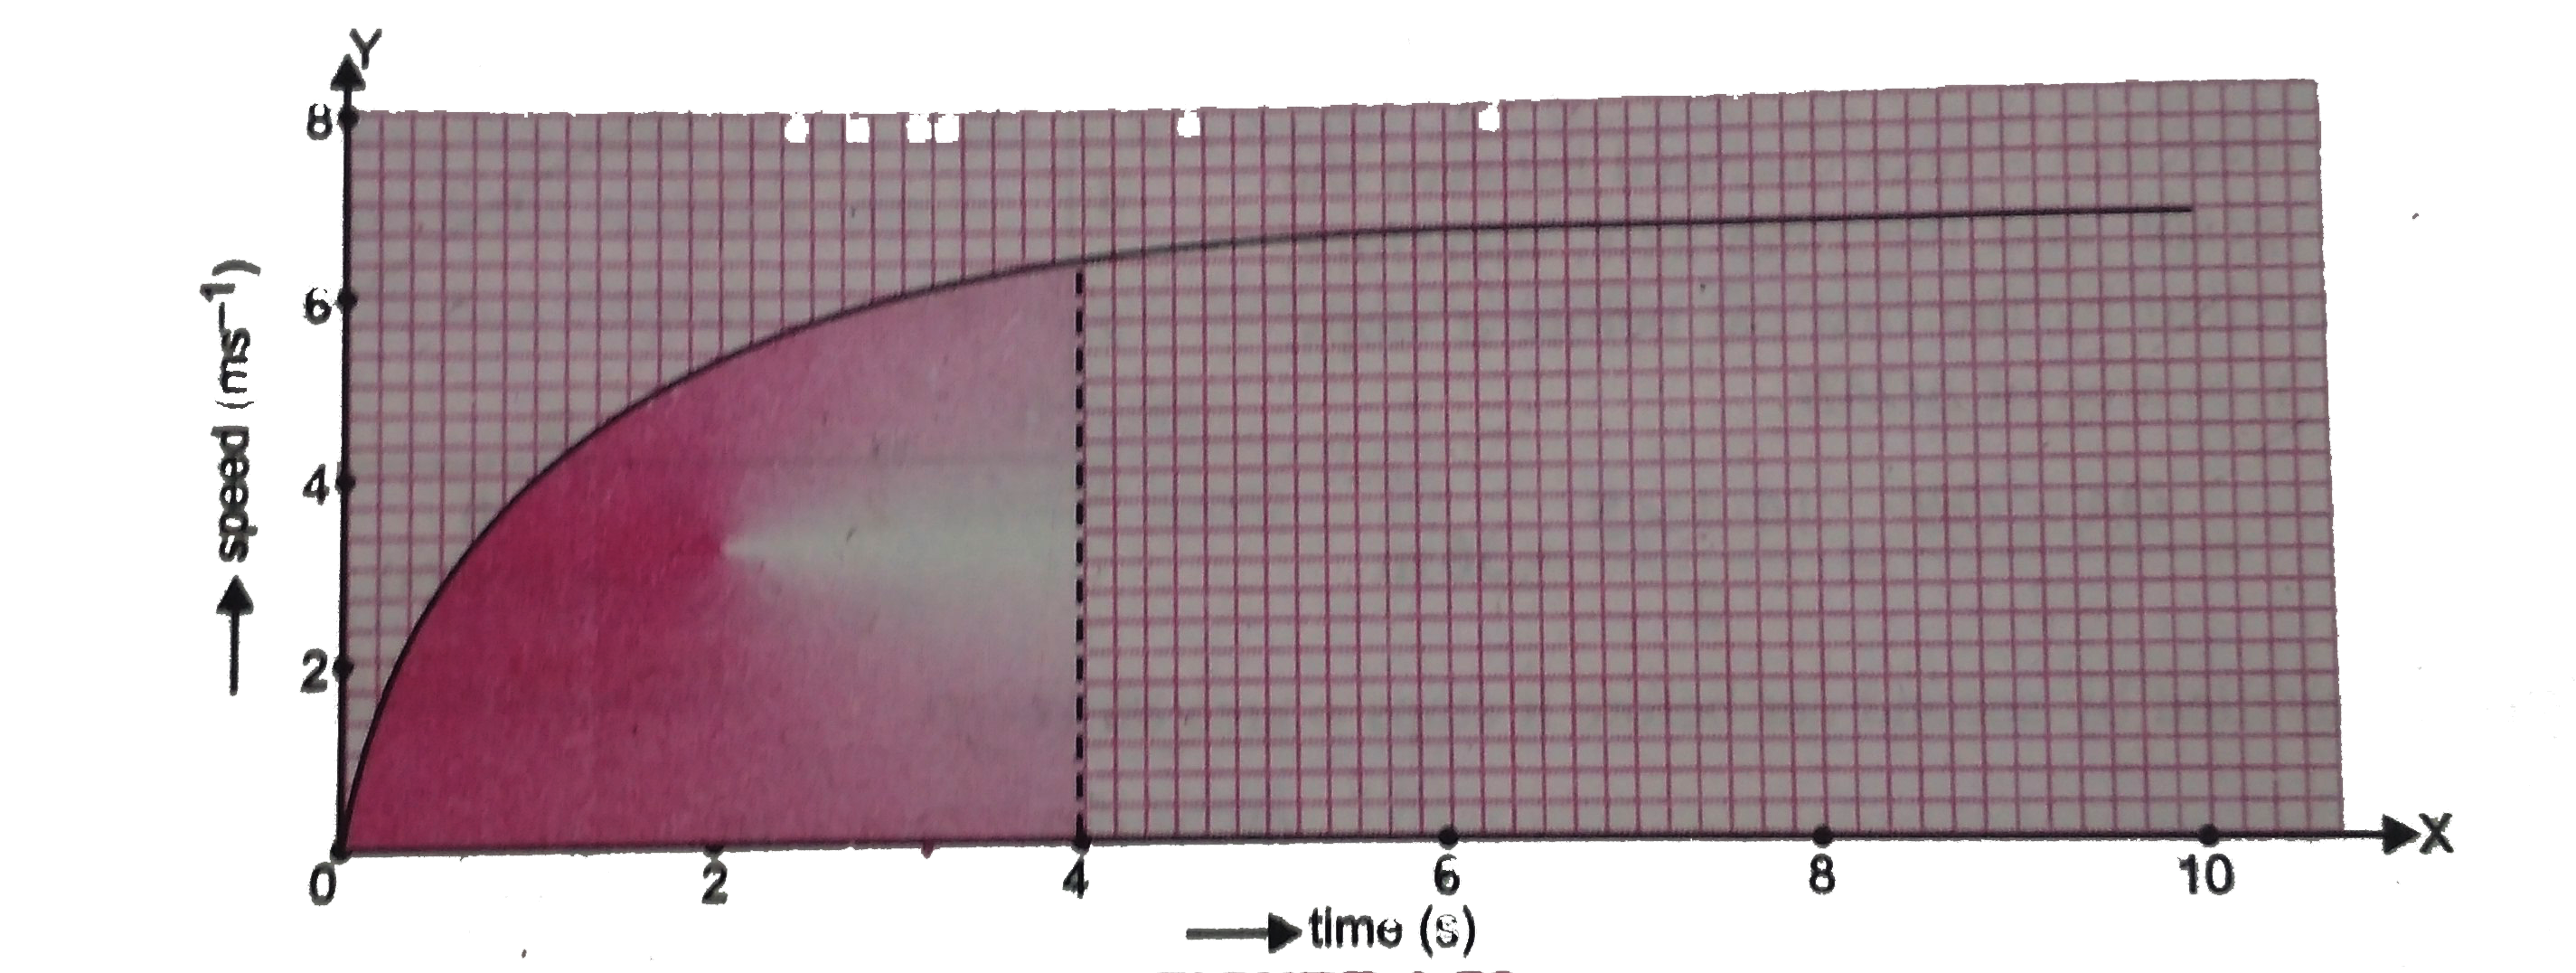
- The speed-time graph for a car is shown is Figure (a) Find how fa...
Text Solution
|
- The speed-time graph for a car is shown is Figure (a) Find how fa...
Text Solution
|
- The speed-time graph for a car is shown is Figure (a) Find how fa...
Text Solution
|
- किसी कार का चाल-समय चित्र में दर्शाया गया है । (a) पहले 4 s में कार ...
Text Solution
|
- The speed-time graph for a car is shown is Fig. Find how far does...
Text Solution
|
- The speed-time graph for a car is shown is Fig. Which part of the...
Text Solution
|
- The speed time graph for a car is shown in fig 8.12 Find out how ...
Text Solution
|
- The speed time graph for a car is shown in fig 8.12 Which part of...
Text Solution
|
- The speed-time graph for a car is shown is Figure (a) Find how fa...
Text Solution
|