


Similar Questions
Explore conceptually related problems
Recommended Questions
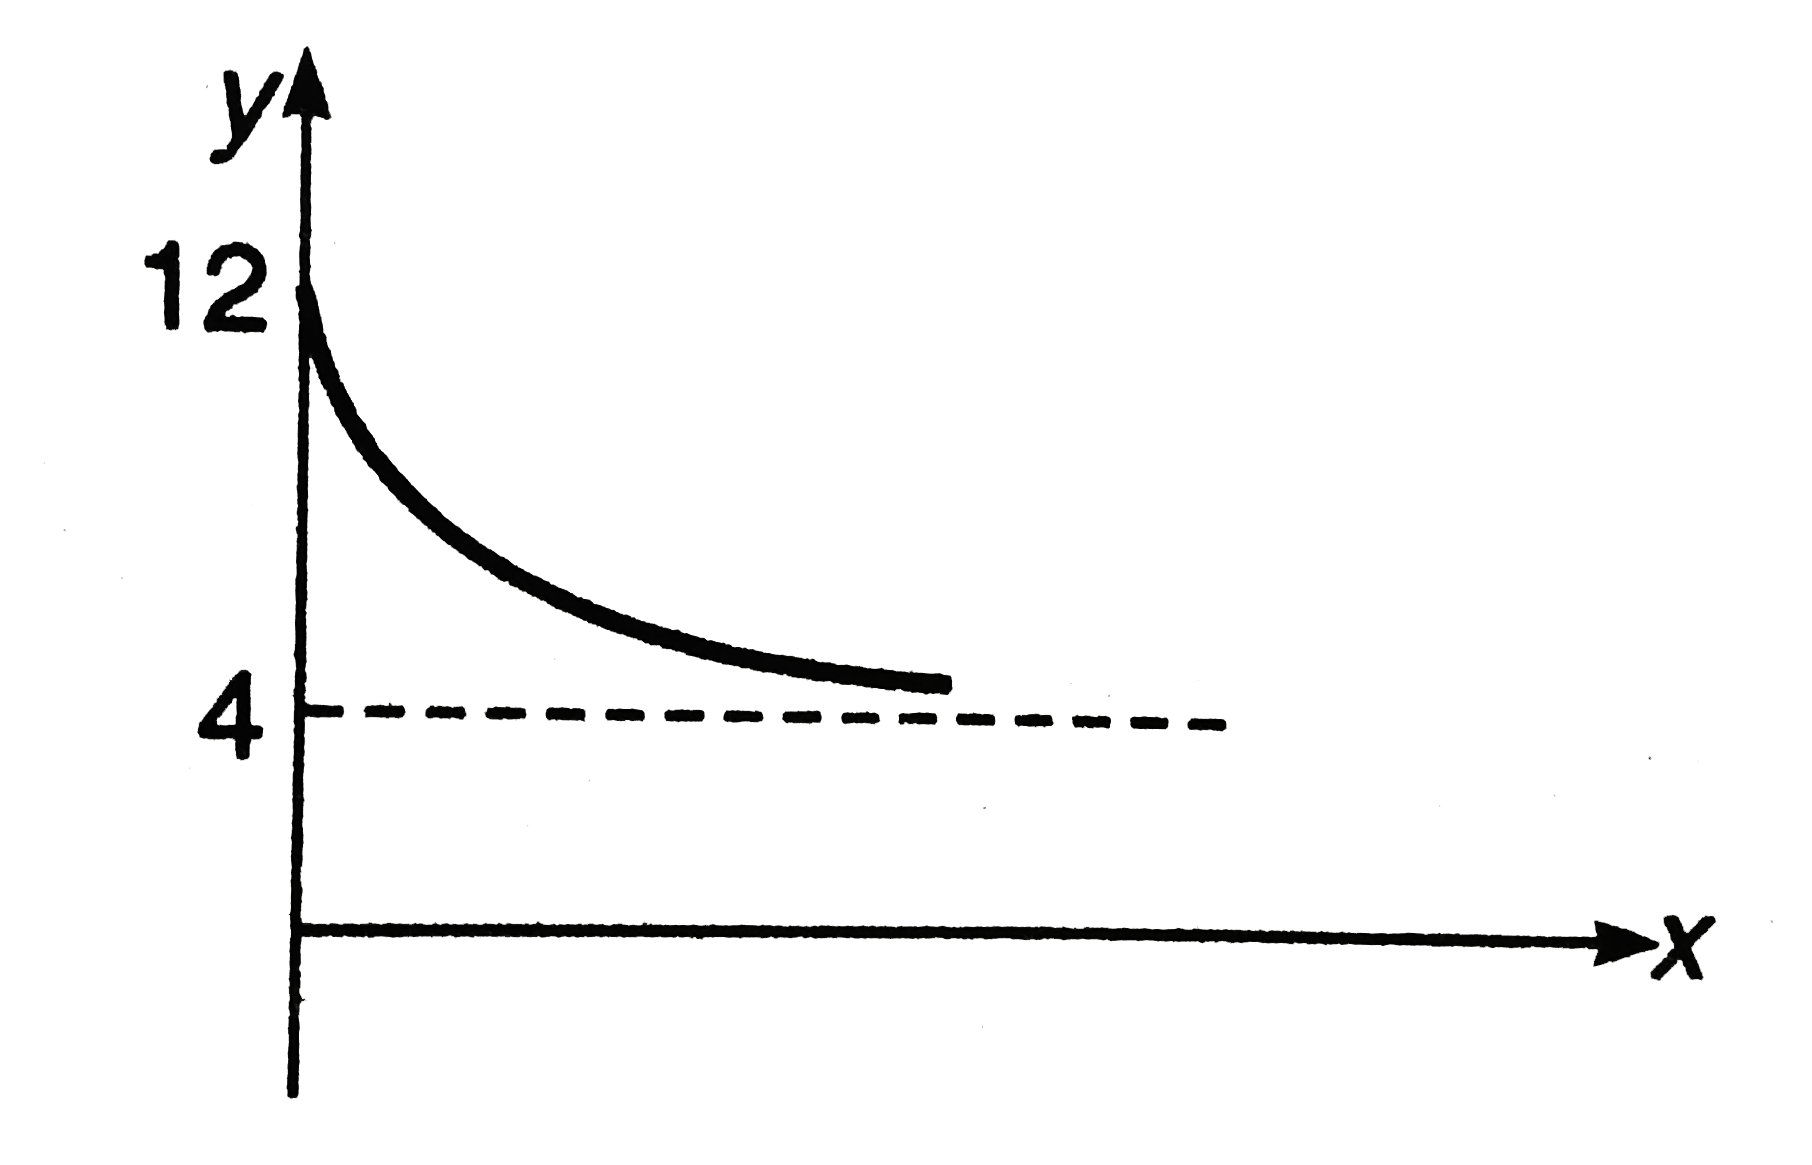
- The graph shown in figure is exponential. Write down the equation corr...
Text Solution
|
- The graph shown in figure is exponential. Write down the equation corr...
Text Solution
|
- The graph shows in figure is exponential. Write down the equation corr...
Text Solution
|
- Corresponding to y - t graph of a transverse harmonic wave shown in fi...
Text Solution
|
- In the given figure is shown a variable y varying exponentially on ano...
Text Solution
|
- The velocity-time graph for a particle moving along X-axis is shown in...
Text Solution
|
- The velocity time graph for a particle moving along x-axis is shown in...
Text Solution
|
- Which of the following is an equation of the graph shown in Figure
Text Solution
|
- The velocity time graph for a particle moving along X-axis is shown in...
Text Solution
|