


Similar Questions
Explore conceptually related problems
Recommended Questions
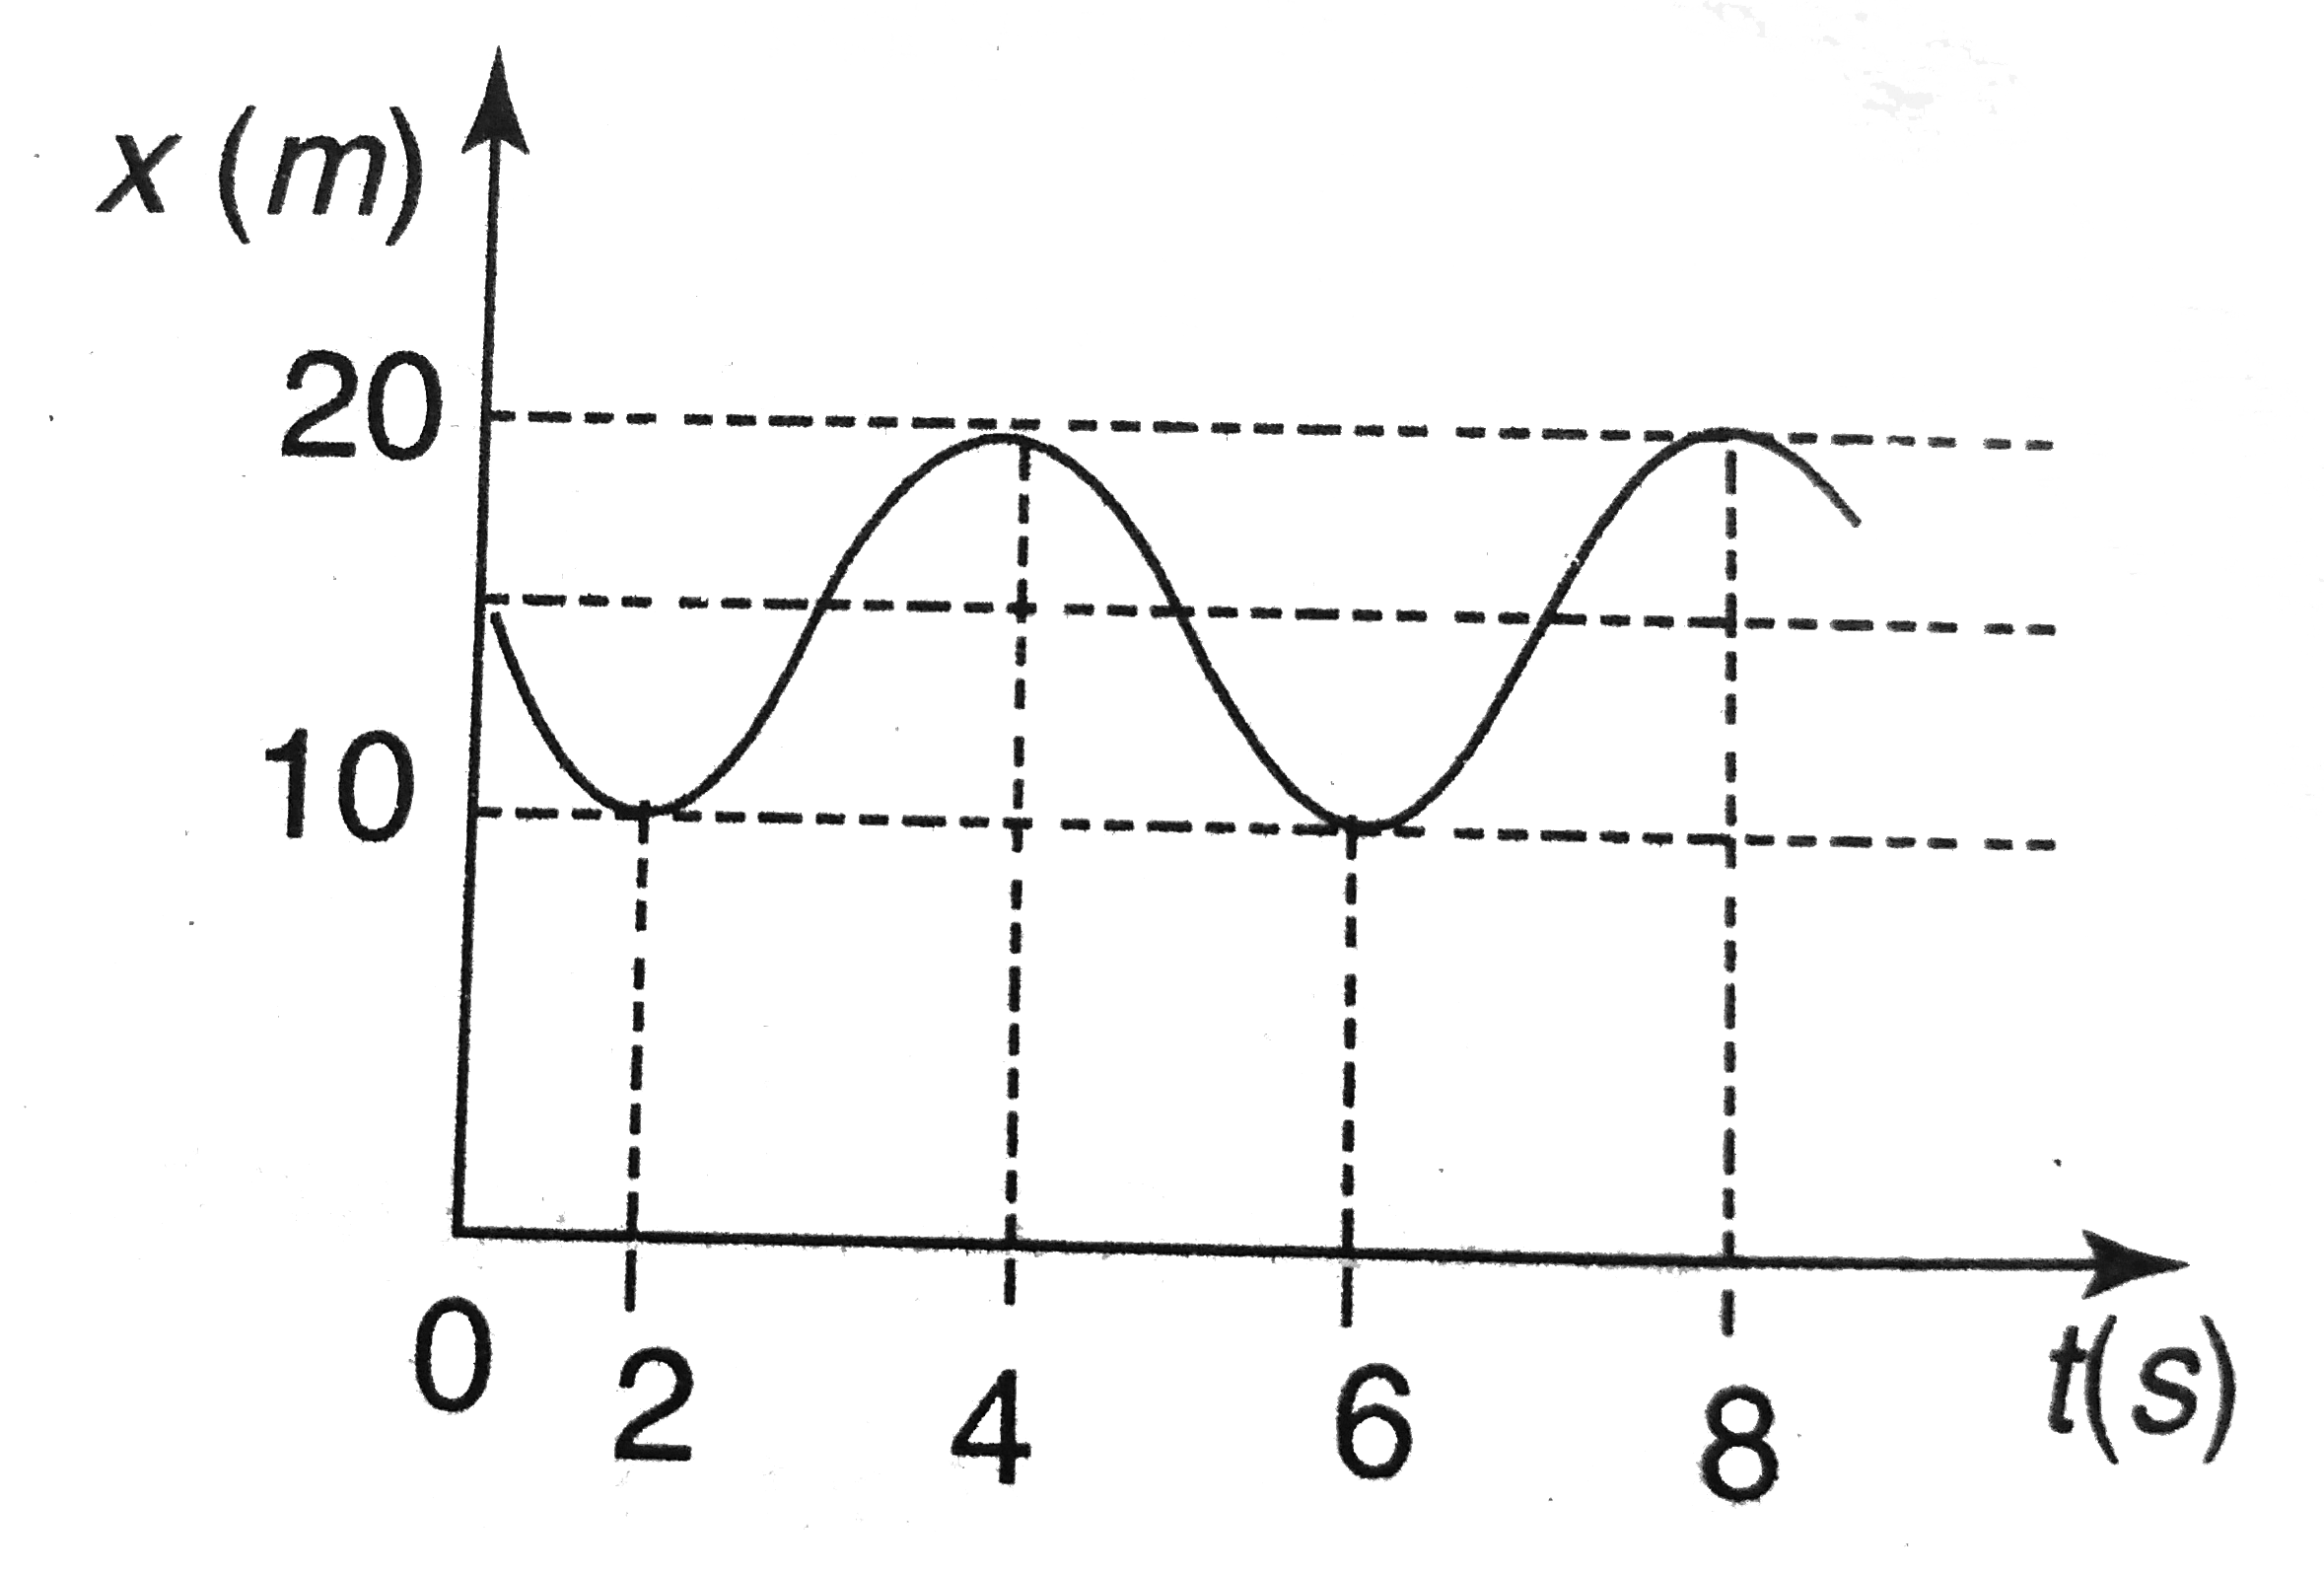
- Figure shows the position of a particle moving on the x-axis as a func...
Text Solution
|
- Figure shows the displacement time graph of a particle moving on the X...
Text Solution
|
- Figure shows the position of a particle moving on the X-axis as a func...
Text Solution
|
- Sound waves are trqvelling along positive x - direction. Displacement ...
Text Solution
|
- Figure shows a plot of the potential energy as a function of x for a p...
Text Solution
|
- Figure shows the position of a particle moving on the x-axis as a func...
Text Solution
|
- The figure shows a velocity-time graph of a particle moving along a st...
Text Solution
|
- Figure shows the position-time graph of a particle moving on the X--ax...
Text Solution
|
- The figure shows a velocity-time graph of a particle moving along a st...
Text Solution
|