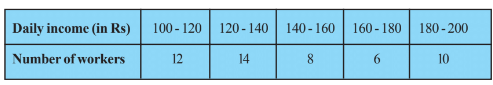
The following distribution gives the daily income of 50 workers of a factory. Convert the distribution above to a less than type cumulative frequency distribution, and draw its ogive.
Text Solution
Verified by Experts
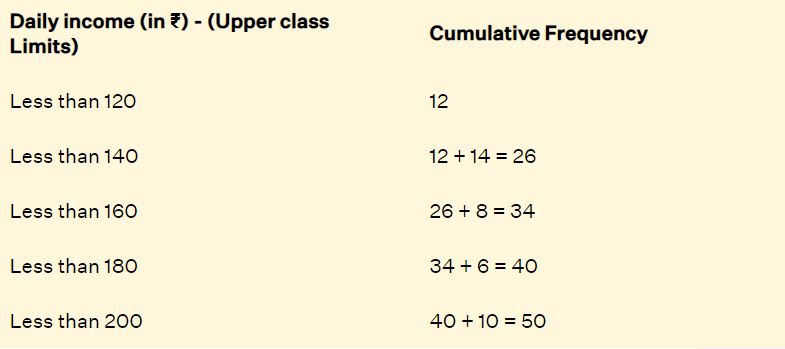
The representation of cumulative frequency distribution graphically is known as a cumulative frequency curve or an ogive.
The frequency distribution table of less than type is as follows:
Taking upper-class limits of class intervals on the x-axis and their respective frequencies on the y-axis, its ogive can be drawn as follows:
...
Topper's Solved these Questions
STATISTICS
NCERT|Exercise EXERCISE 14.2|6 Videos
STATISTICS
NCERT|Exercise EXERCISE 14.1|9 Videos
STATISTICS
NCERT|Exercise Solved Examples|9 Videos
SOME APPLICATIONS OF TRIGONOMETRY
NCERT|Exercise SOLVED EXAMPLES|7 Videos
SURFACE AREAS AND VOLUMES
NCERT|Exercise EXERCISE 13.2|8 Videos
Similar Questions
Explore conceptually related problems
The following distribution gives the daily income of 60 workers of a factory.Convert the distribution above to a less than type cumulative frequency distribution,and draw its ogive.
Write the following data into less than cummulative frequency distribution table.
The following distribution gives the daily income of 50 workers of a factory: Daily income (in Rs): 100-120 120-140 140-160 160-180 180-200 Number of workers: 12 14 8 6 10 Convert the above distribution to a less than type cumulative frequency distribution and draw its ogive.
Draw a less than ogive for the following frequency distribution.
Draw a 'less than' ogive for the following frequency distribution:
Consider the following frequency distribution : What is the above frequency distribution known as?
Convert the following cumulative frequency distribution into a simple frequency distribution
Convert the following cumulative frequency distribution into a simple frequency distribution