Text Solution
Verified by Experts


Similar Questions
Explore conceptually related problems
Recommended Questions
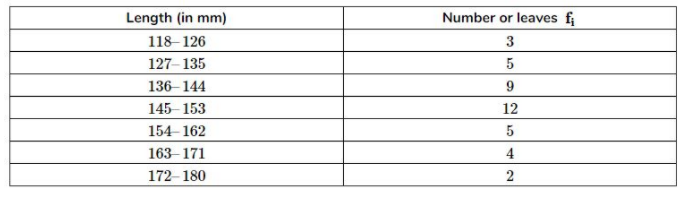
- The lengths of 40 leaves of a plant are measured correct to the neare...
Text Solution
|
- The lengths of 40 leaves of a plant are measured correct to the neare...
Text Solution
|
- Match the following Column A to Column B
Text Solution
|
- The inequation represented by the graph given below is : <img src="htt...
Text Solution
|
- The inequation that best describes the following graph is <img src="h...
Text Solution
|
- एक पौधें की 40 पत्तियों की लम्बाईयाँ निकटतम मिलिमीटरों में मापी है तथा...
Text Solution
|
- एक पौधे की 40 पत्तियों की लम्बाई निकलता मिलिमीटरो में मापी जाती है तथा...
Text Solution
|
- The lengths of 40 leaves of a plant are measured correct to the neares...
Text Solution
|
- The lengths of a plant's 40 leaves were measured to the nearest mi...
Text Solution
|