Text Solution
Verified by Experts


Similar Questions
Explore conceptually related problems
Recommended Questions
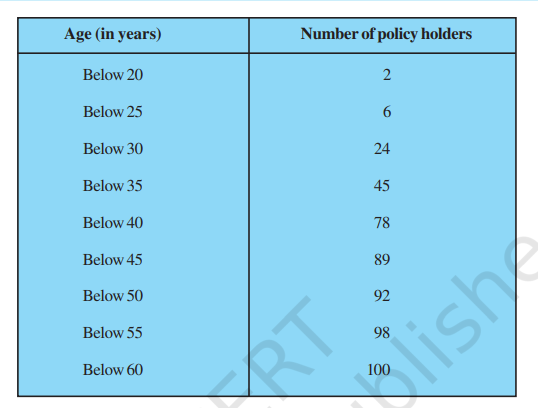
- A life insurance agent found the following data for distribution of a...
Text Solution
|
- A life insurance agent found the following data for distribution of a...
Text Solution
|
- Determine the point of symmetry of a regular hexagon. <img src="htt...
Text Solution
|
- Match the following Column A to Column B
Text Solution
|
- Match the following Column A to Column B
Text Solution
|
- The inequation represented by the graph given below is : <img src="htt...
Text Solution
|
- The inequation that best describes the graph given below is <img src=...
Text Solution
|
- The inequation that best describes the following graph is <img src="h...
Text Solution
|
- एक जीवन बीमा एजेंट 100 पॉलिसी धारकों की आयु के बंटन के निम्नलिखित आँकड़...
Text Solution
|