A
B
C
D
Text Solution
Verified by Experts


Topper's Solved these Questions
Similar Questions
Explore conceptually related problems
ALLEN-RACE-RACE 19
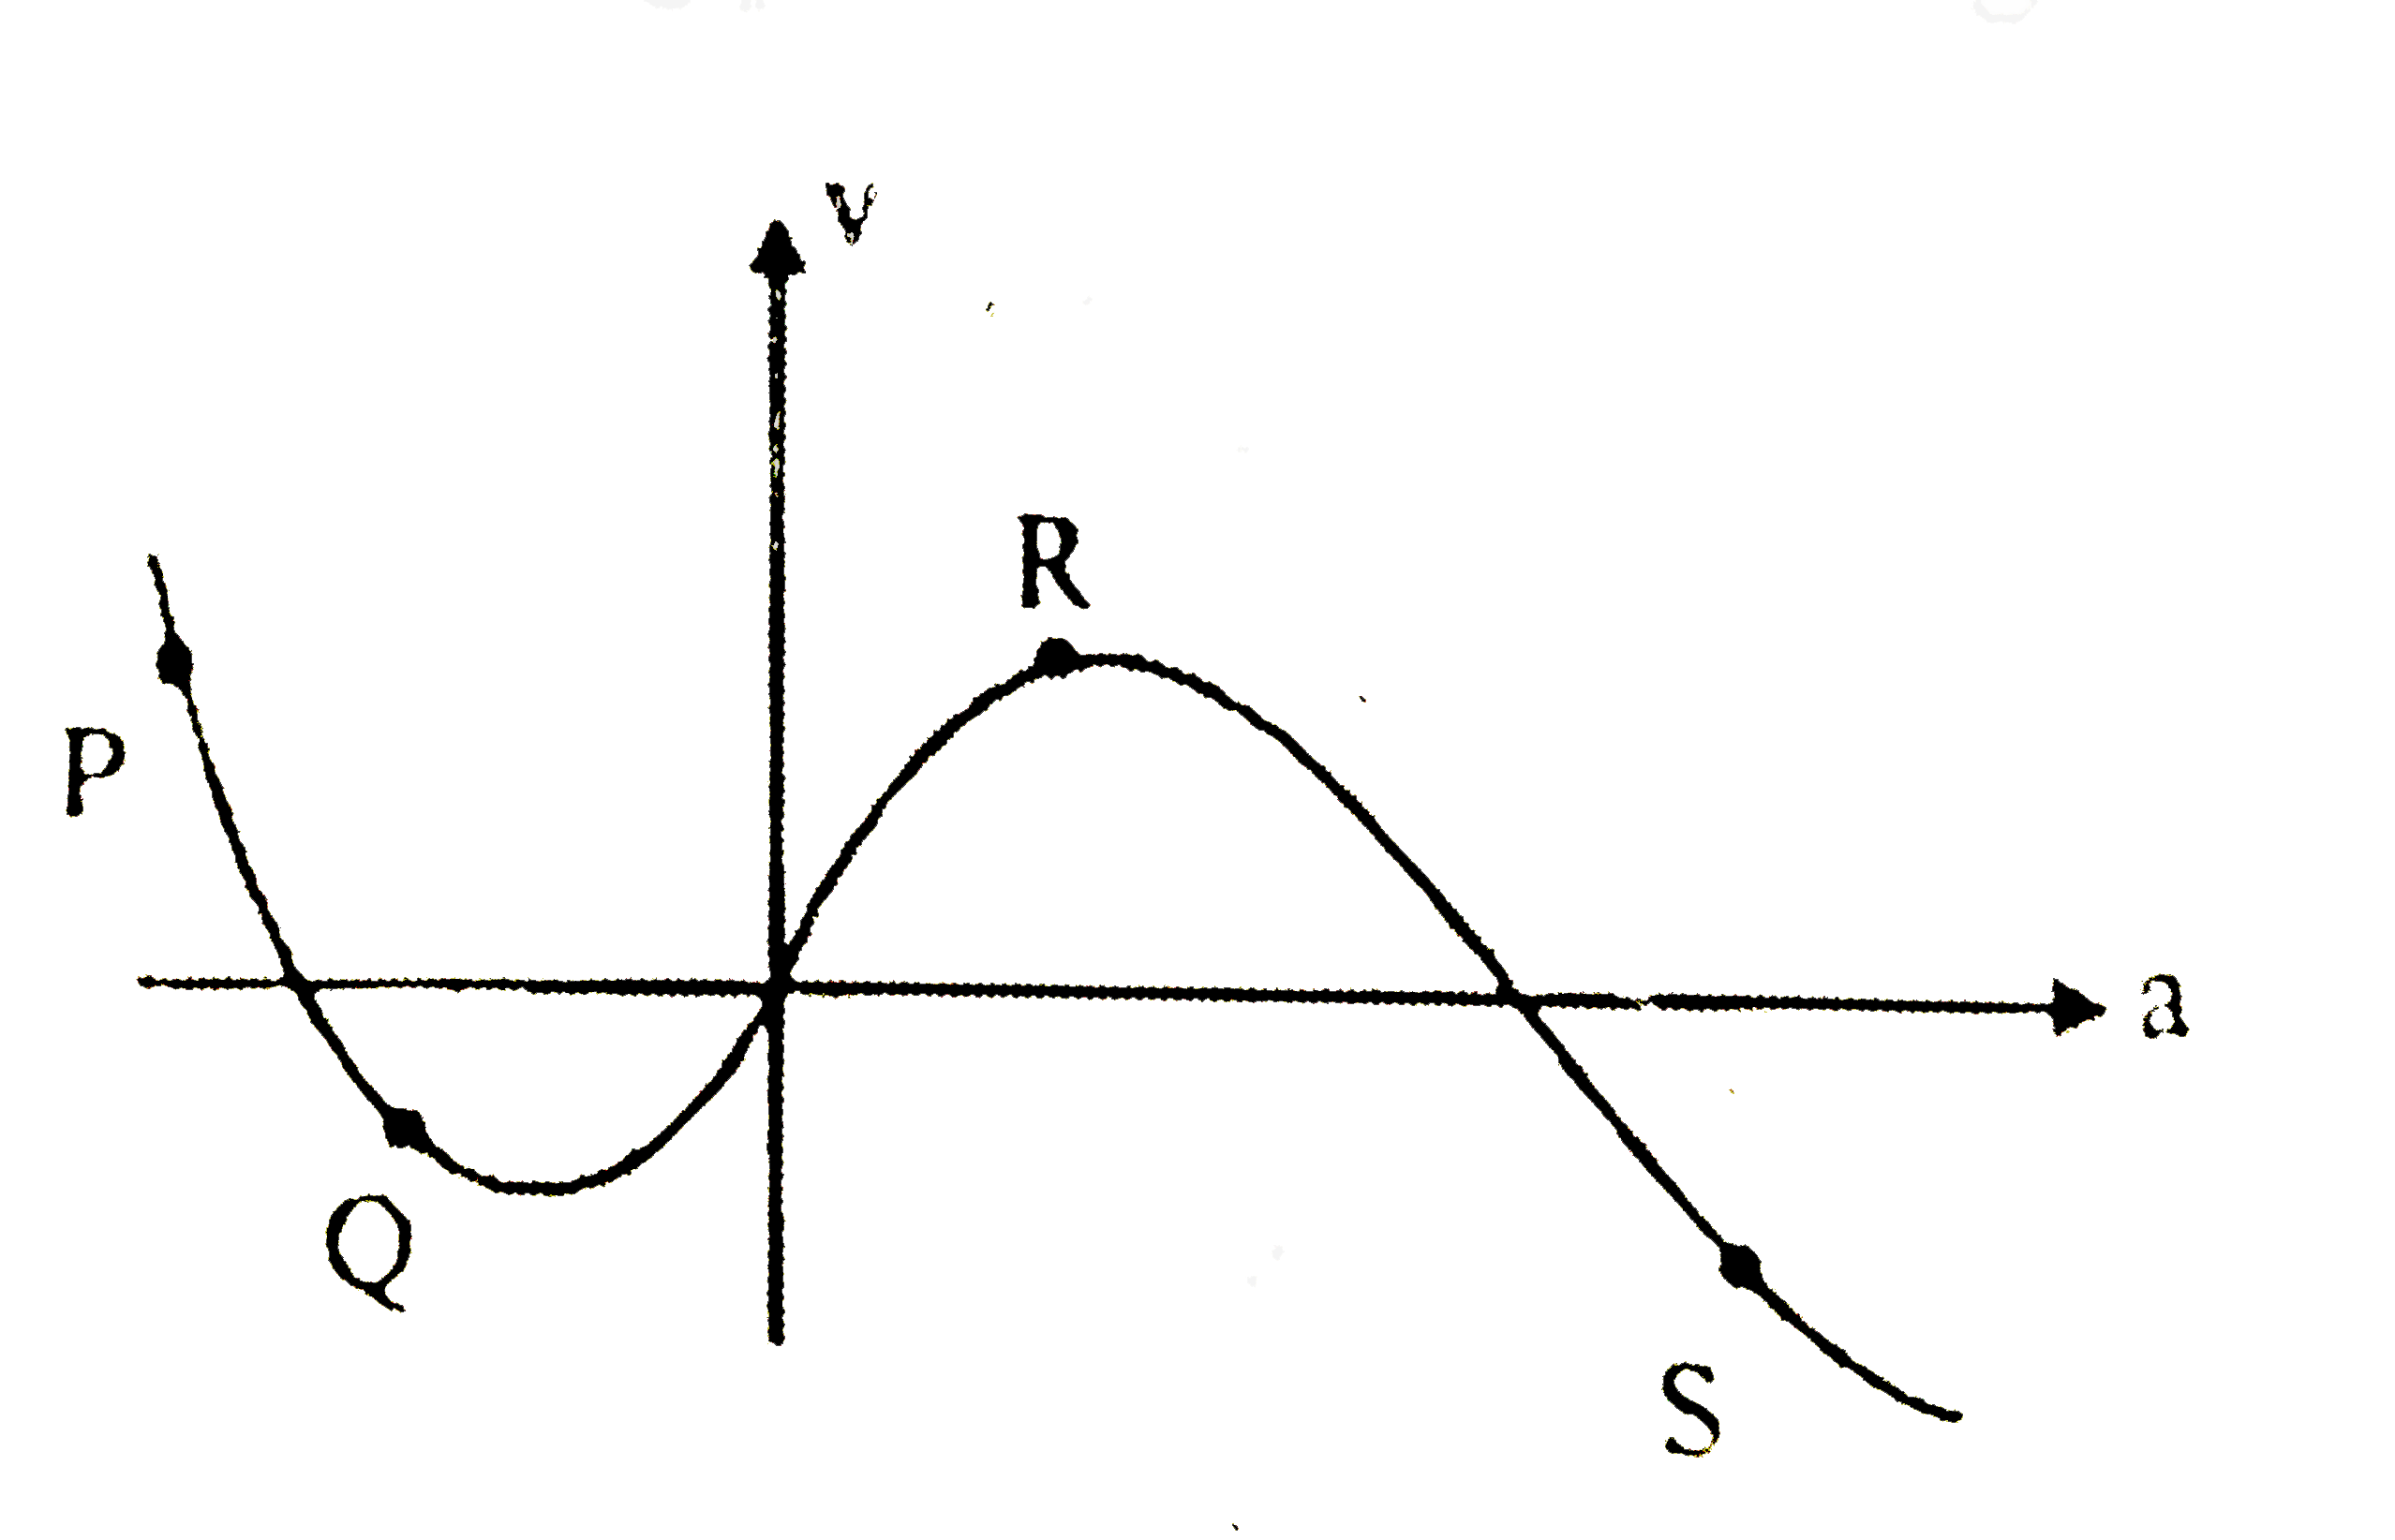
- Acceleration-velocity graph of a moving particle is shown in figure. T...
Text Solution
|
- In the picture shown, a ball standing from rest rolls down a ramp AB,g...
Text Solution
|
- Figure shows a sine curve, as the displacement time curve of a particl...
Text Solution
|
- A physics student studies rectilinear motion of a body and prepares th...
Text Solution
|
- Match the following and write the correct pairs for the most generaliz...
Text Solution
|
- A particle moves on x-axis with a velocity which depends on time as pe...
Text Solution
|