


Similar Questions
Explore conceptually related problems
Recommended Questions
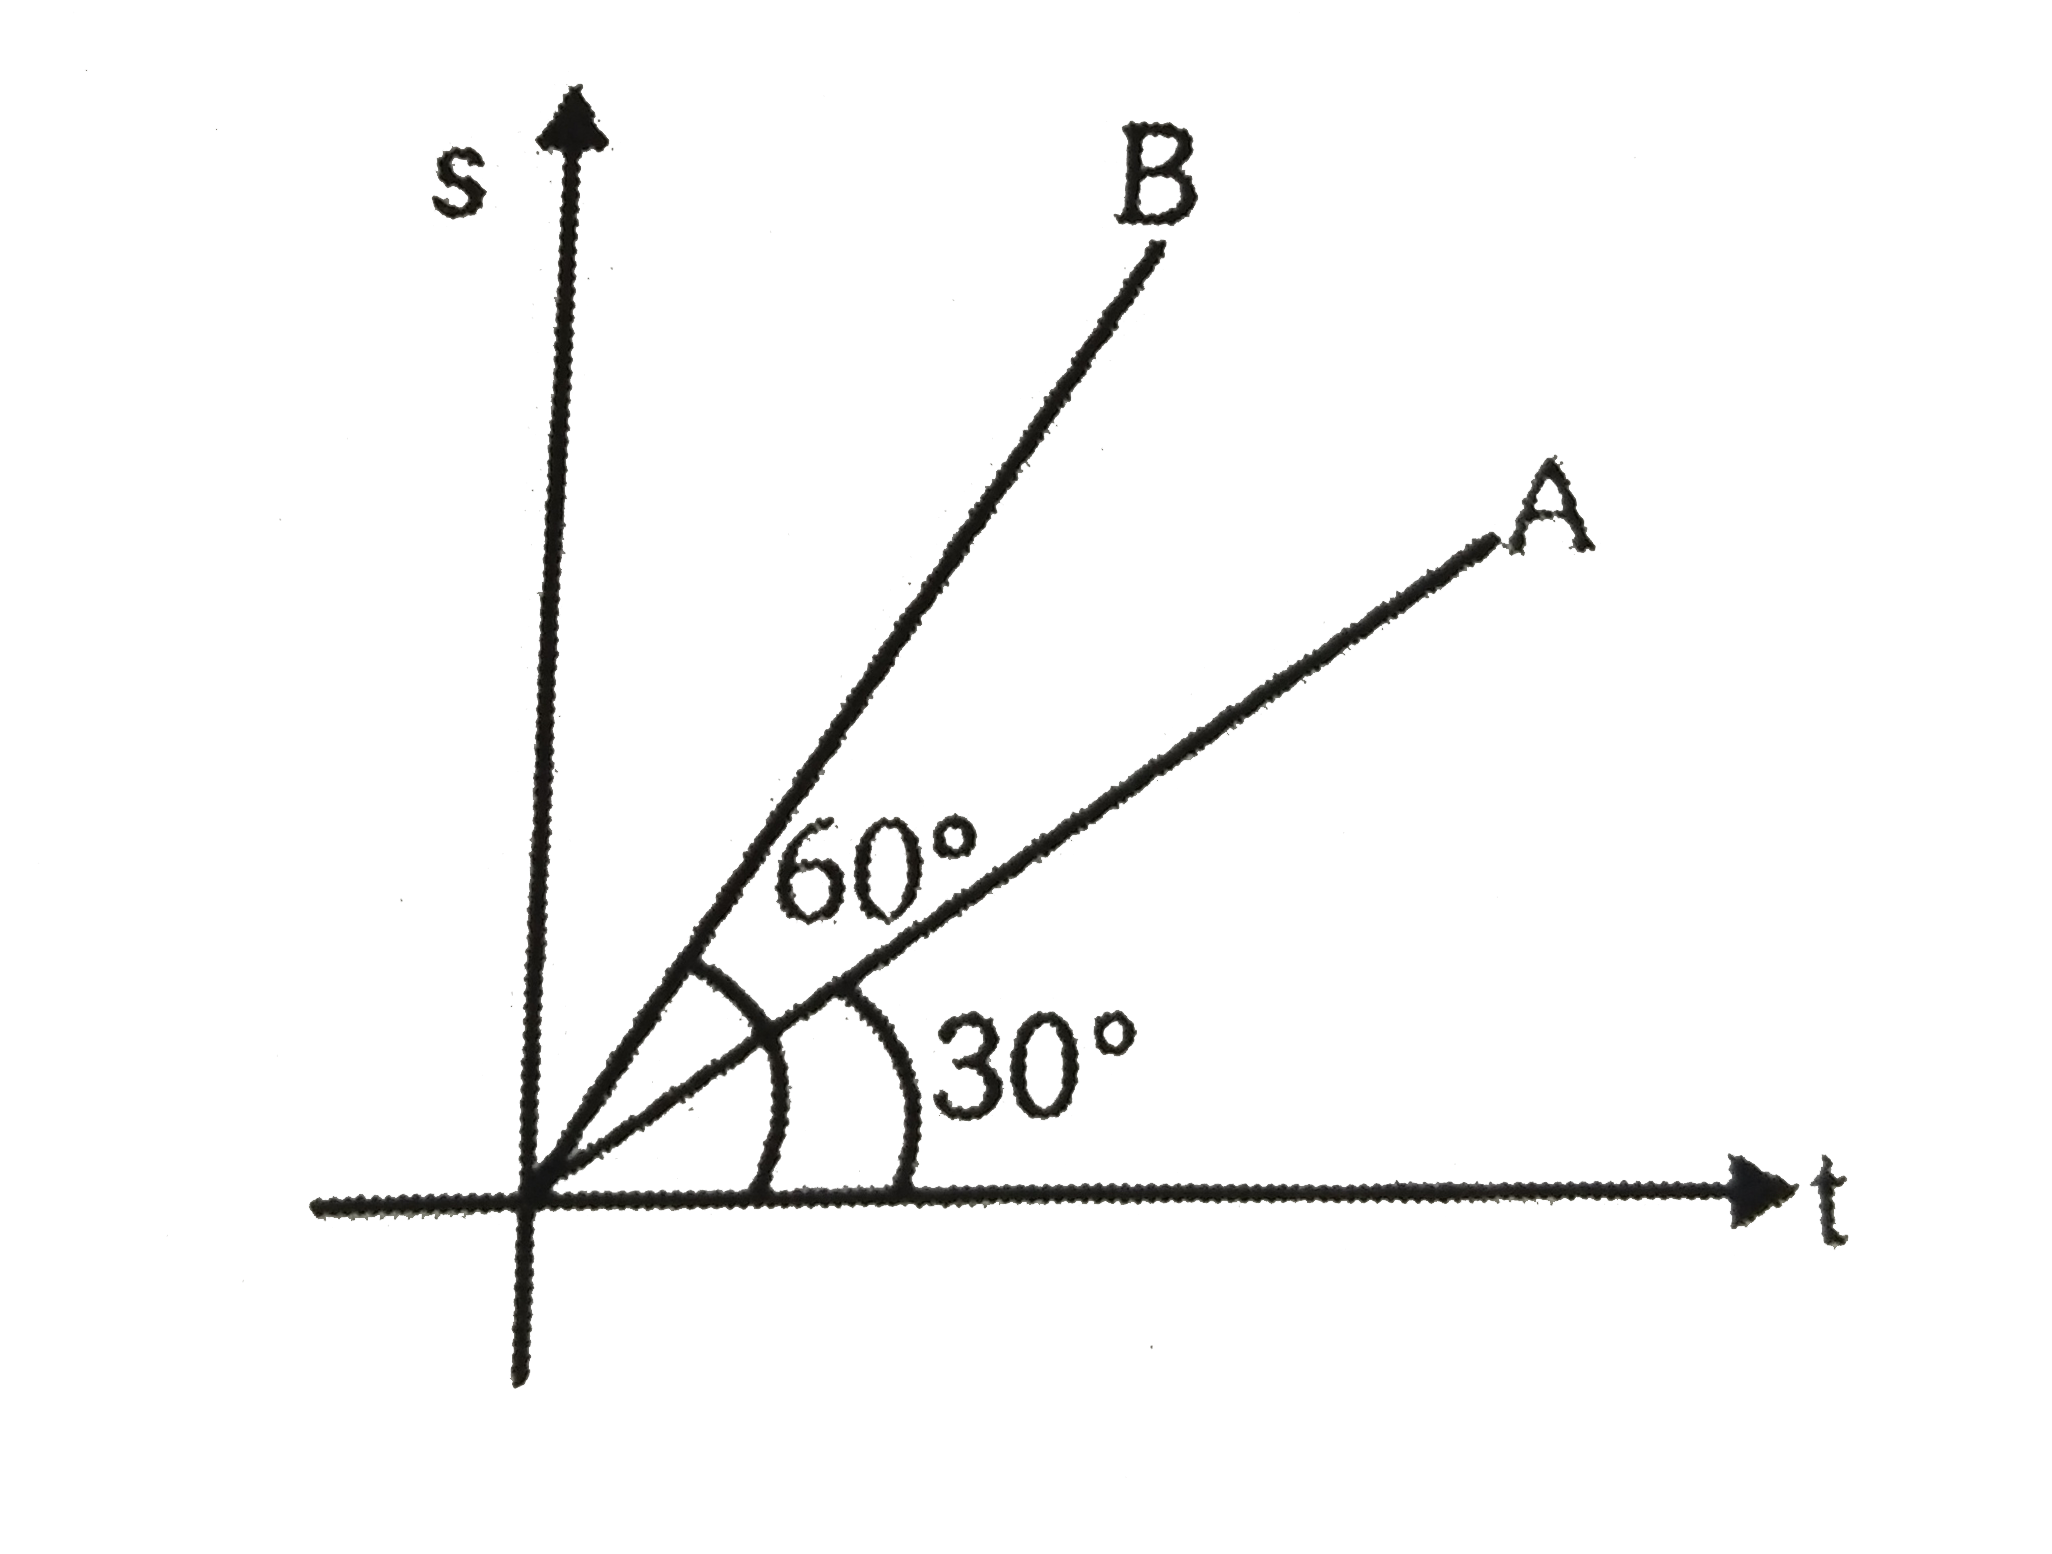
- s-t graph of two particles A and B are shown in fig. Find the ratio of...
Text Solution
|
- s-t graph of a particle in motion is as shown below. (a) State, whethe...
Text Solution
|
- Accleration-time graph of a particle moving in a straight line is as s...
Text Solution
|
- Velocity-time graph of a particle moving in a straight line is shown i...
Text Solution
|
- Two particles A and B are moving with uniform velocity as shown in (Fi...
Text Solution
|
- The displacement-time graph for two particles is as shown. Find the ra...
Text Solution
|
- The displacement time graphs of two bodies A and B are shown in figure...
Text Solution
|
- s-t graph of two particles A and B are shown in fig. Find the ratio of...
Text Solution
|
- s-t graph of a particle in motion is shown in Fig. Calculate Aver...
Text Solution
|