Home
Class 11
PHYSICS
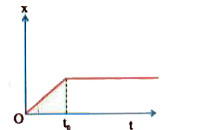
Figure show the displacement - time grap...

Figure show the displacement - time graph of a particle moving on the x-axis

A

the particle is continuously going in positive X direction

B

the particle is at rest

C

the velocity increases up to a time `t_(0)` and then becomes constant.

D

the particle moves at constant velocity up to a time `t_(0)` and then stops.

Text Solution

Verified by Experts

The correct Answer is:
D
Doubtnut Promotions Banner Mobile Dark
|

Similar Questions

Explore conceptually related problems

Figure shows the displacement time graph of a particle moving on the X-axis

Figure shows the displacement (x)-time (f) graph of a particle moving on the X-axis.

Knowledge Check

  • Figure (i) and (i) show the displacement-time graphs of two particles moving along the x-axis. We can say that

    A
    both the particles are having a uniformly retarded motion
    B
    both the particles are having a uniformly acceleraled motion
    C
    Particle (1) is having a uniformly accelerated motion while particle (i) is having a uniformly retarded motion
    D
    Particle (i) is having a uniformly retarded motion while particle (ii) is having a uniformly accelerated motion
  • Figures (i) and (ii) below show the displacement-time graphs of two particles moving along the x -axis. We can say that

    A
    Both the particles are having a uniformly accelerated motion
    B
    Both the particles are having a uniformly retarded motion
    C
    Particle (i) is having a uniformly accelerated motion while particle (ii) is having a uniformly retarded motion
    D
    Particle (i) is having a uniformly retarded motion while particle (ii) is having a uniformly accelerated motion
  • Figure shows the position-time graph of a particle moving on the X--axis. Which of these option correctly describes the particle 's motion?

    A
    the particle is continuously going in positive x direction
    B
    the particle is at rest
    C
    the velocity increases up to a time and then becomes constant
    D
    the particle moves at a constant velocity up to a time and then stops
  • Similar Questions

    Explore conceptually related problems

    Figure shows the displacement-time graph of a particle moving in a straight line. Find the signs of velocity and acceleration of particle at time t = t_1 and t = t_2.

    The diagram shows the displacement - time graph for a particle moving in a straight line. The distance (in m) coverted by the particle in the time interval t=0 to t=5s is

    Figure shows the displacement of a particle going along the X-axis as a function of time. The force acting on the particle is zero in the region

    The figure shows the displacement-time graph of a particle executing SHM . If the time period of oscillation is 2s , then the equation of motion is given by

    The fig. shows the displacement time graph of a particle moving on a straight line path. What is the magnitude of average velocity of the particle over 10 seconds?