Text Solution
Verified by Experts


Topper's Solved these Questions
Similar Questions
Explore conceptually related problems
CENGAGE-GRAPHICAL TRANSFORMATIONS-Exercise
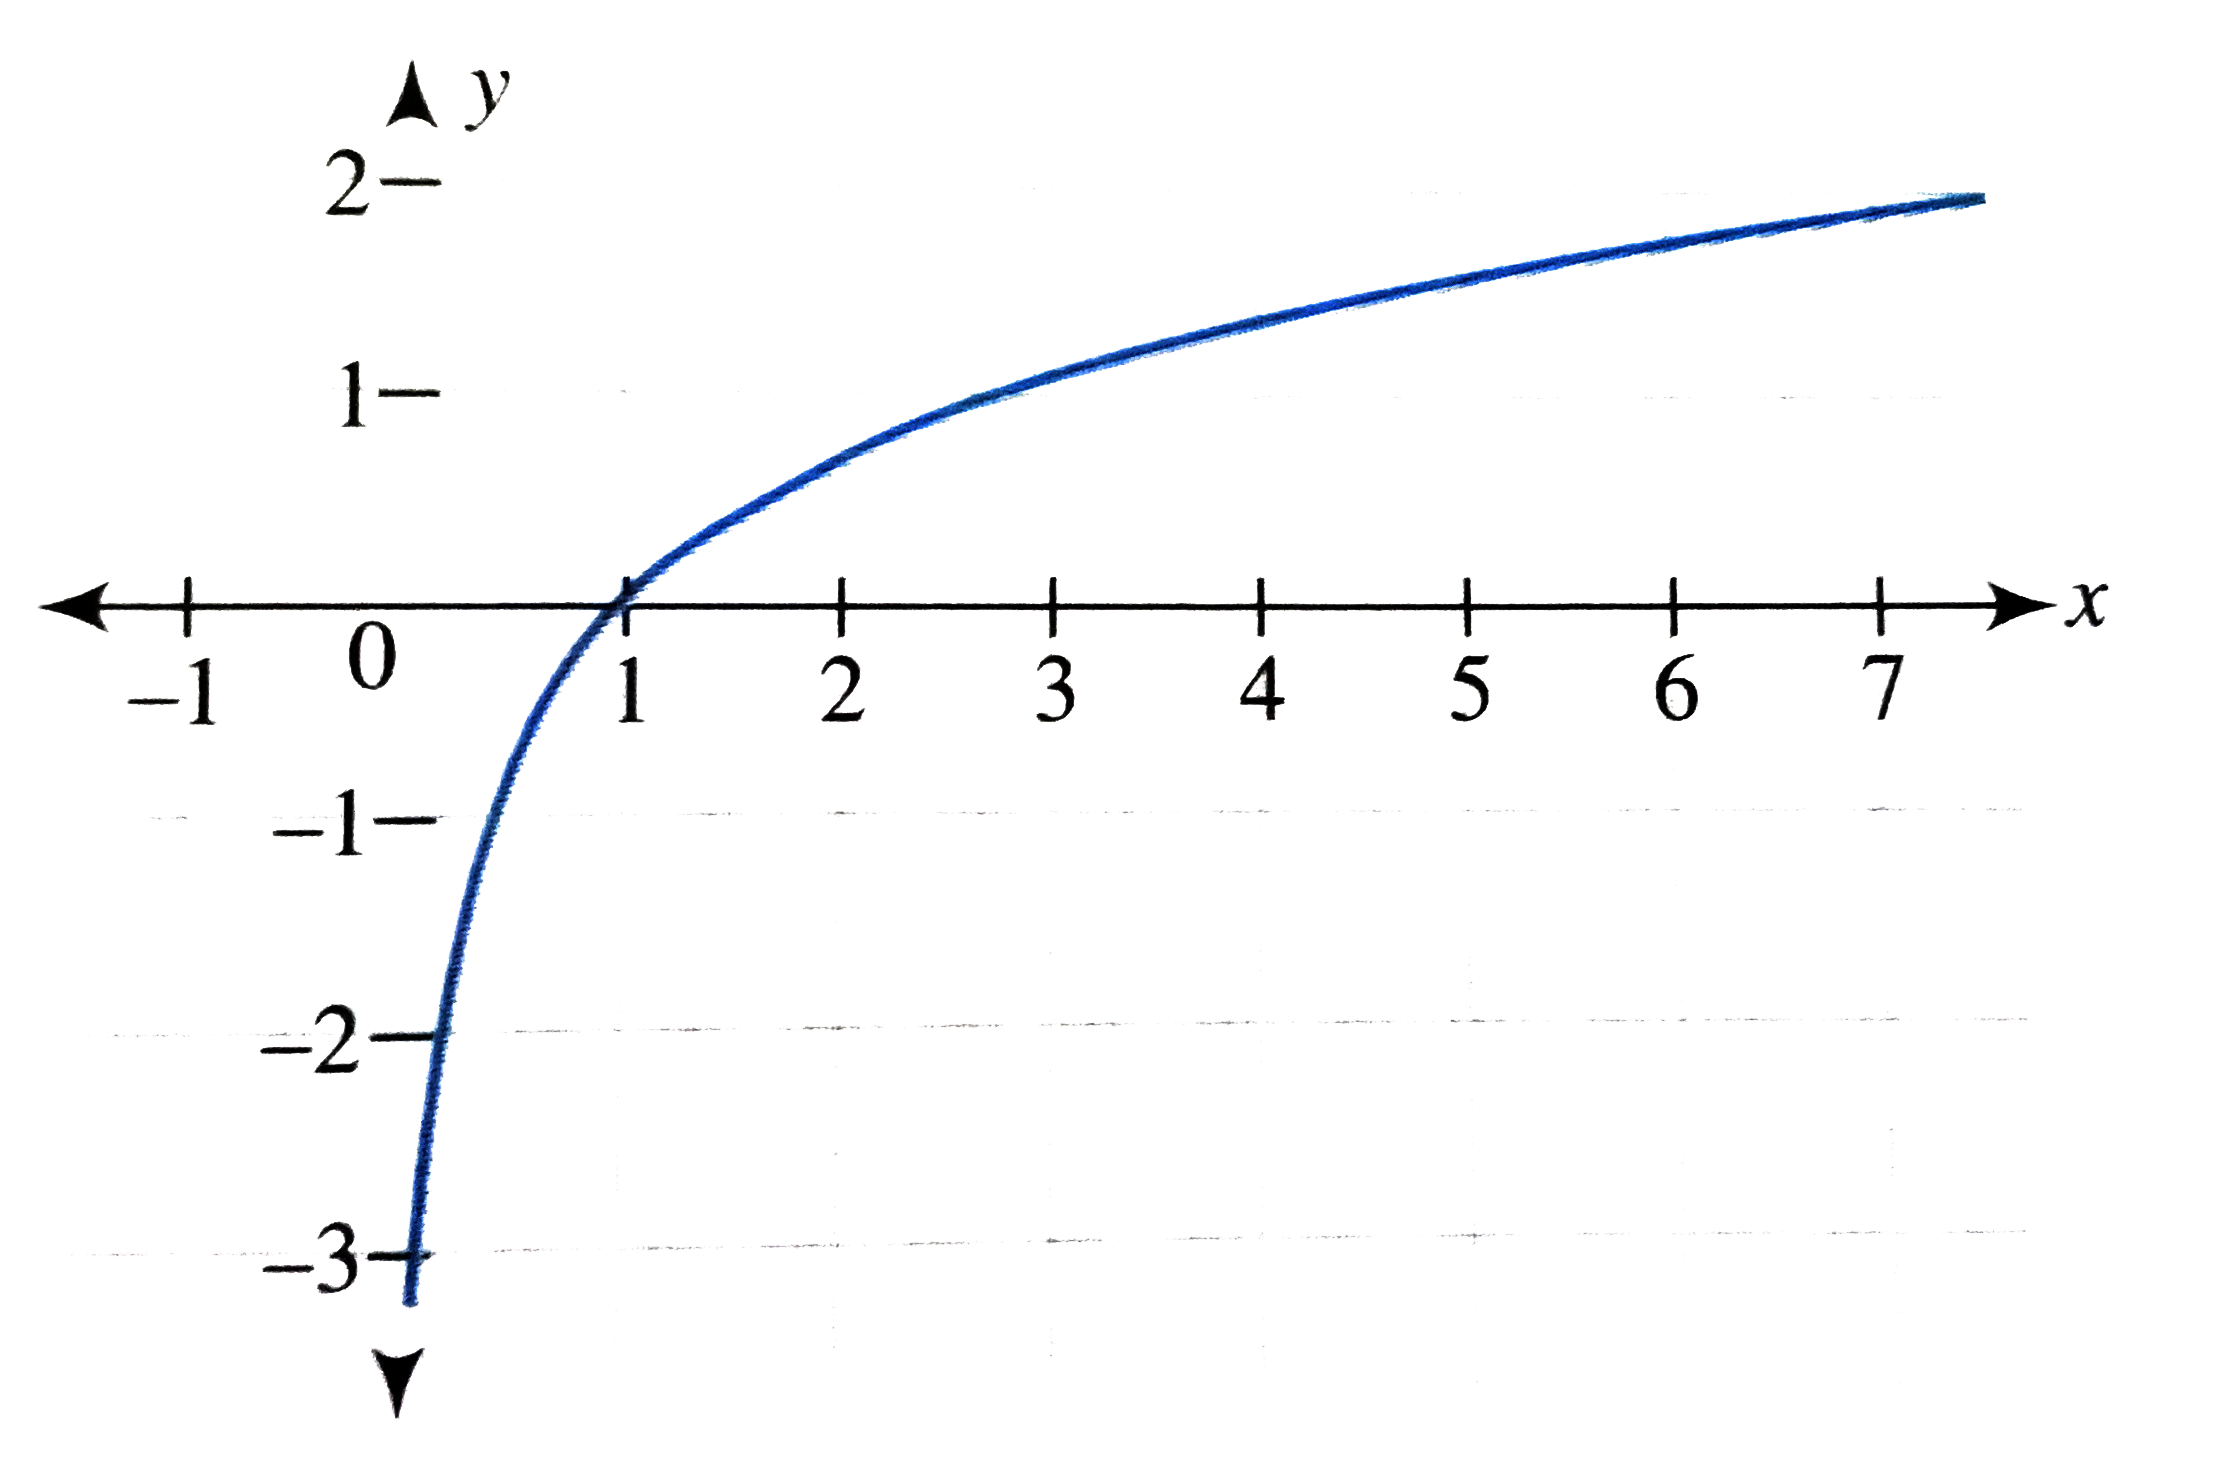
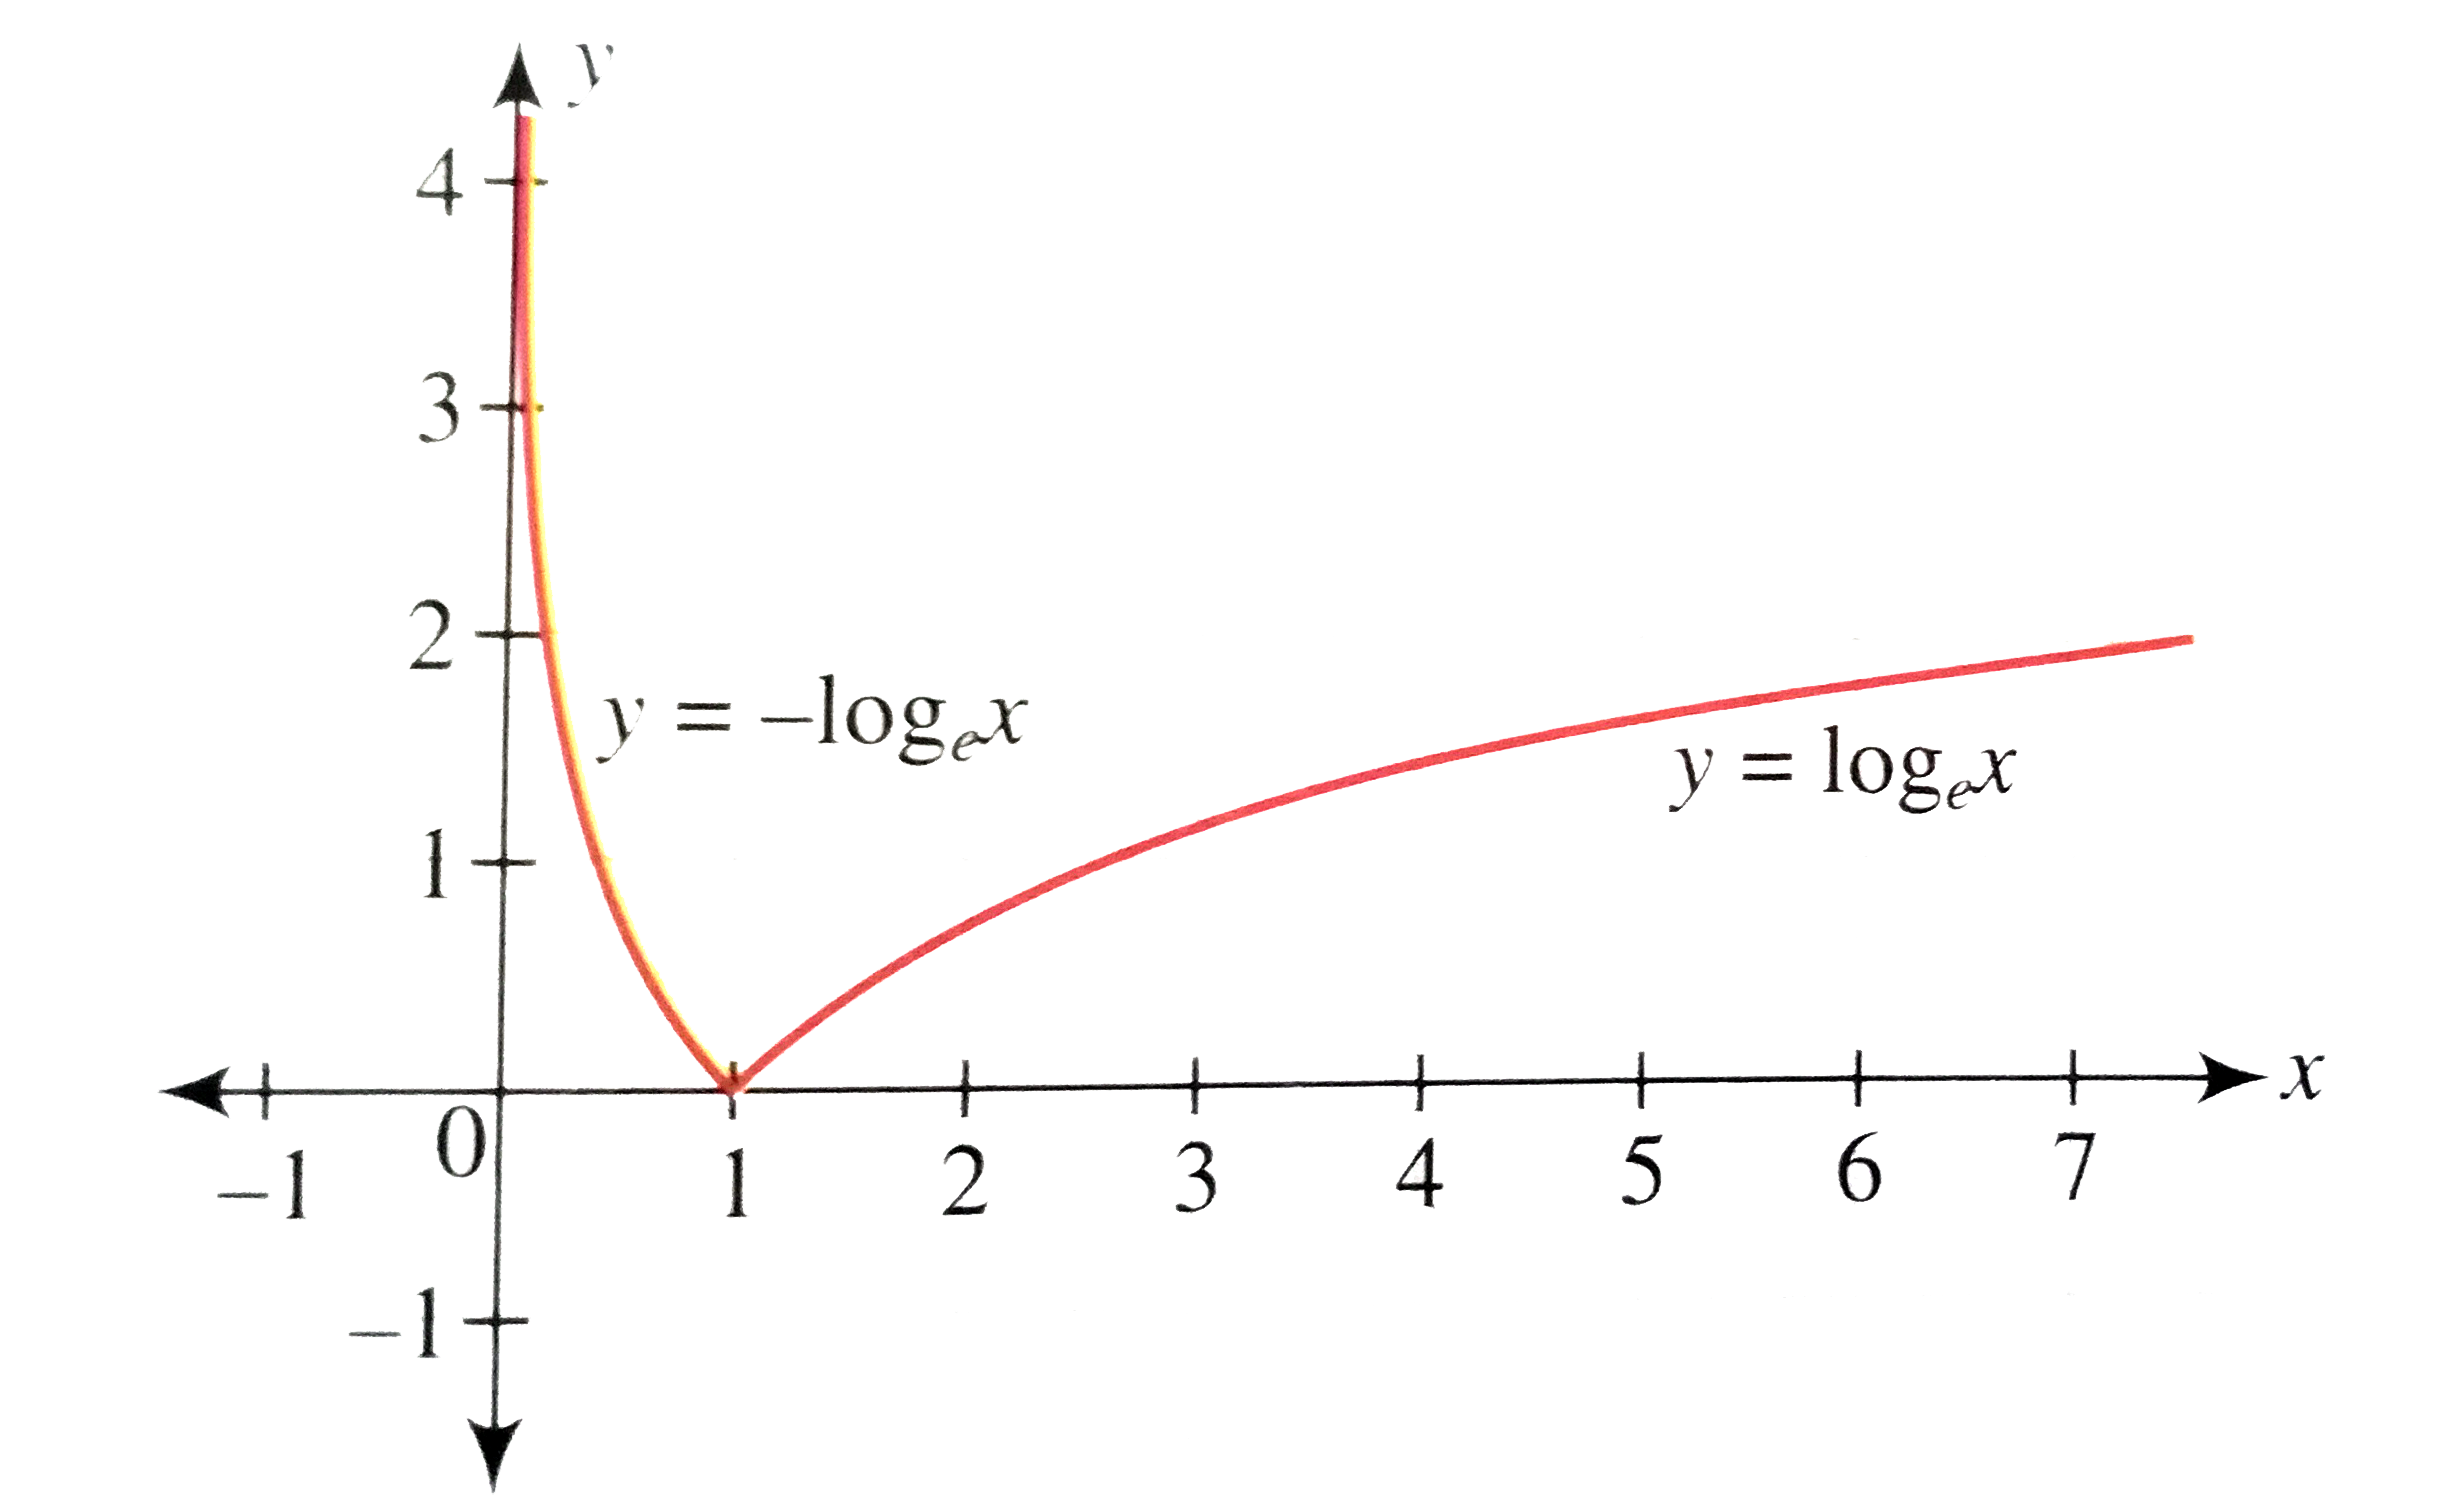
- Draw the graph of y=|logx|.
Text Solution
|
- Draw the graph of y=tan^(-1)x-cot^(-1)x.
Text Solution
|
- Draw the graph of y=|(1)/(|x|)-2|.
Text Solution
|
- Draw the graph of y=tan^(-1)x+cos^(-1)x+sin^(-1)x.
Text Solution
|
- Draw the graph of |y|=(x-1)(x-2)(x-3).
Text Solution
|
- Draw the graph of y=2sin^(-1)(x//3).
Text Solution
|
- Draw the graph of y=cot^(-1)|x|.
Text Solution
|
- Draw the graph of y=sec^(-1)|x|.
Text Solution
|
- Draw the graph of y=|log(e)(x+3)|.
Text Solution
|
- Draw the graph of y=|log(e)|x||.
Text Solution
|
- Draw the graph of y=|{x}-0.5|, where {.} represents the fractional par...
Text Solution
|
- Draw the graph of y=|sinx|+sin|x|.
Text Solution
|
- If the graph of y=|f(x)| is as shown in figure then the graph of y=f(...
Text Solution
|
- The number of real solutions of the equation sqrt(1+cos2x)=sqrt(2)sin^...
Text Solution
|
- Find the number of real solutions to the equation log(0.5)|x|=2|x|.
Text Solution
|
- Find the number of points where the function f(x)=max|tanx|,cos|x|) is...
Text Solution
|
- Find the number of points of non-diferentiability for f(x)=max{||x|-1|...
Text Solution
|
- Let f(x) = max. {|x^2 - 2| x ||,| x |} then number of points where f(x...
Text Solution
|
- Draw the graph of |y|=[x], where [.] represents the greatest integer f...
Text Solution
|
- Draw the graph of |2x|+|y|=2 using graphical transformation.
Text Solution
|
- Consider the function f(x)={2x+3, x le 1 and -x^2+6, x > 1 Then draw t...
Text Solution
|