


Similar Questions
Explore conceptually related problems
Recommended Questions
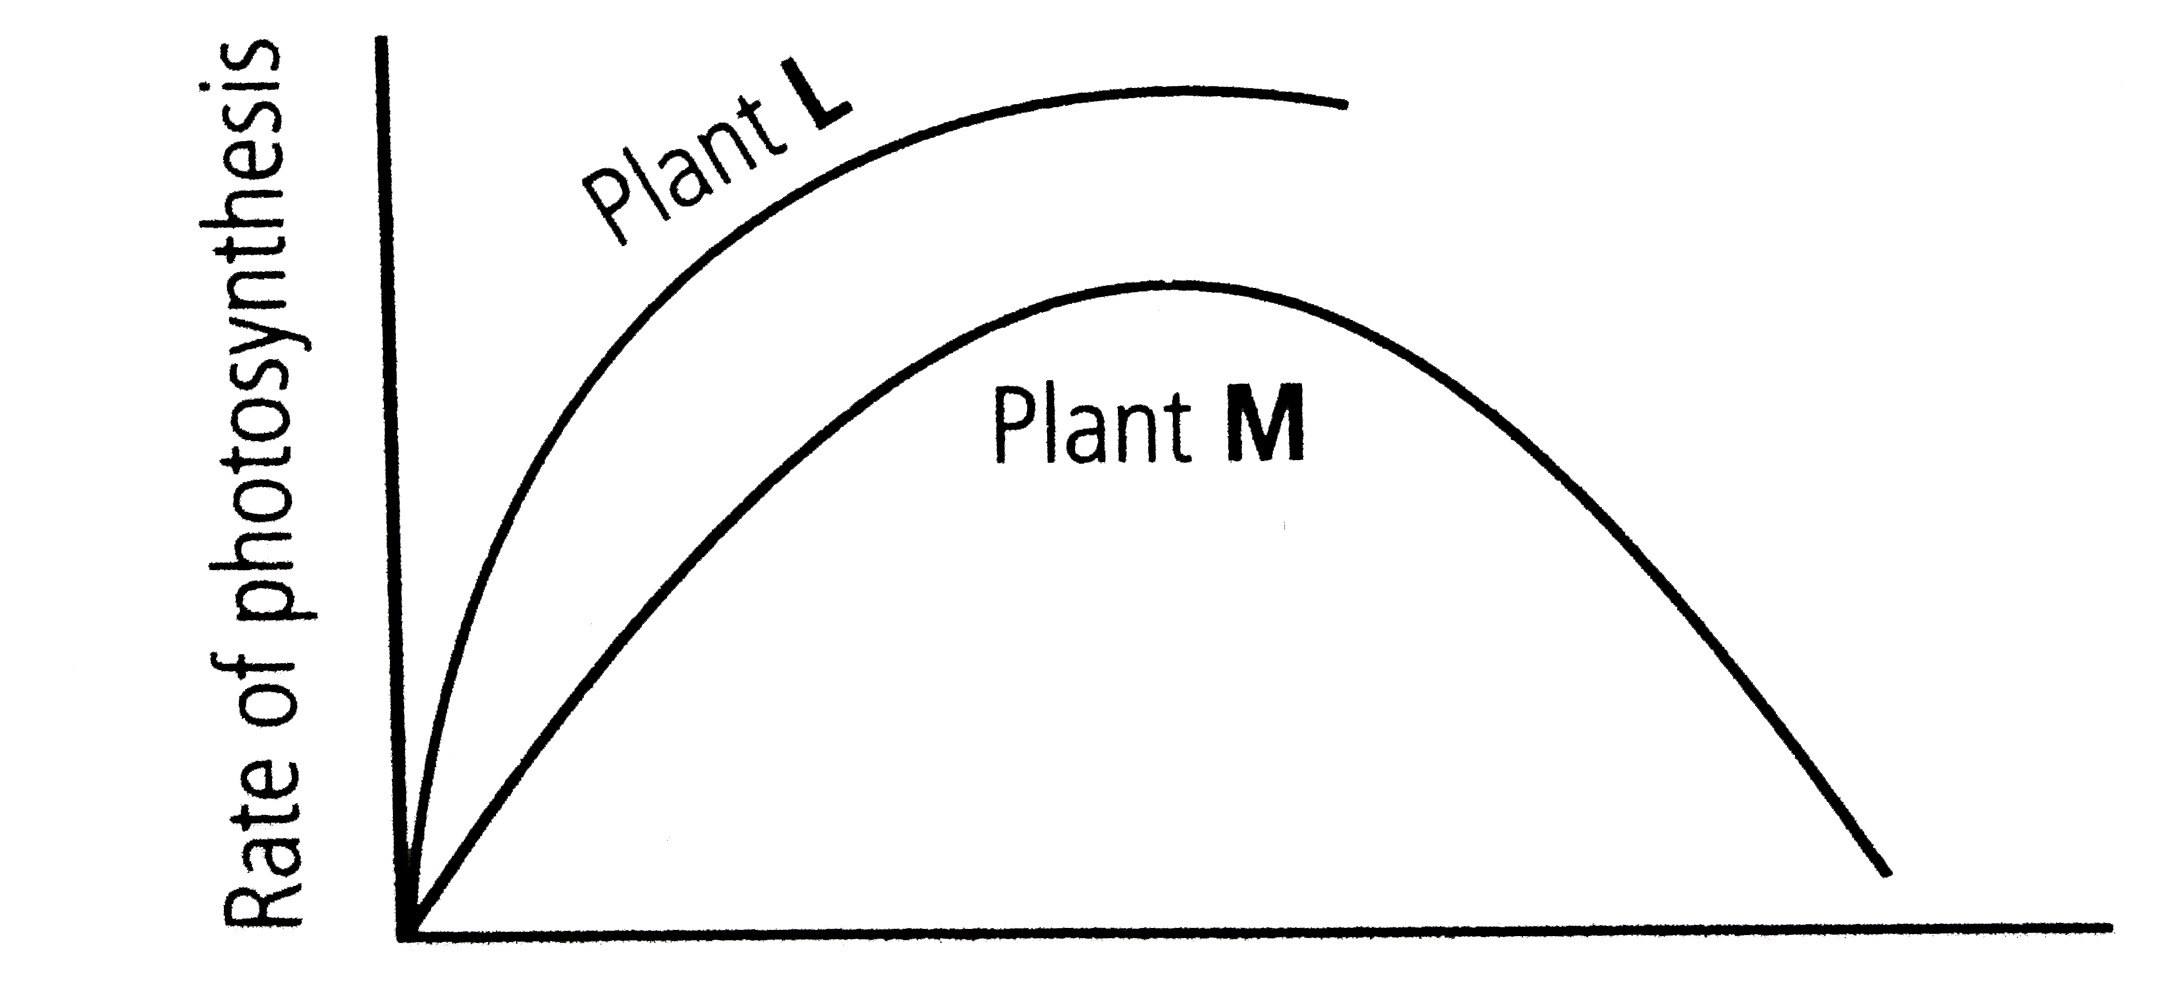
- When two plants L and M were exposed to different light intensities an...
Text Solution
|
- Study the given graph showing the efect of light intensity on the rate...
Text Solution
|
- When two plants L and M were exposed to different light intensities an...
Text Solution
|
- Identify the graph which correctly represents the spectral intensity v...
Text Solution
|
- The graph showing rate of photosynthesis at different wavelength of li...
Text Solution
|
- The rate of photosynthesis is the highest when a plant is exposed to
Text Solution
|
- निम्न ग्राफ दो विभिन्न प्रकाश संवेदी पदार्थो एवं विभिन्न तीव्रताओं के ...
Text Solution
|
- विश्लेषक से निर्गत प्रकाश की तीव्रता का परिवर्तन प्रदर्शित करने वाला ग...
Text Solution
|
- Which of the following graphs correctly gives the relationship betwee...
Text Solution
|