


JEE MAINS PREVIOUS YEAR-JEE MAINS 2020-PHYSICS
- Orange light of wavelength 6000xx10^(-10)m illuminates a single slit o...
Text Solution
|
- The distance between an object and a screen is 100 cm. A lens can prod...
Text Solution
|
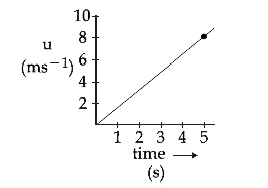
- The speed verses time graph for a particle is shown in the figure. The...
Text Solution
|
- A block of mass m = 1 kg slides with velocity upsilon = 6 m//s on a fr...
Text Solution
|
- A uniform rope of length 12 mm and mass 6 kg hangs vertically from a r...
Text Solution
|
- When a diode is forward biased, it has a voltage drop of 0.5 V. The sa...
Text Solution
|
- screw gauge of pitch 0.1 cm and 50 division on circular scale measure ...
Text Solution
|
- Model a torch battery of length l to be made up of a thin cylindrical ...
Text Solution
|
- Consider a gas of triatomic molecules. The molecules are assumed to be...
Text Solution
|
- An elliptical loop having resistance R, of semi major axis a, and semi...
Text Solution
|
- A balloon filled with helium (32^@C and 1.7 atm) bursts. Immediately a...
Text Solution
|
- When the wavelength of radiation falling on a metal is changed from 50...
Text Solution
|
- Two isolated conducting spheres S1 and S2 of radius 2/3 R and 1/3 R ha...
Text Solution
|
- The fraction of a radioactive material which reamins active after time...
Text Solution
|
- Moment of inertia of a cylinder of mass M, length L and radius R about...
Text Solution
|
- A satellite is moving in a low nearly circular orbit around the earth....
Text Solution
|
- The pressure inside two soap bubbles is 1.01 and 1.02 atmosphere. The ...
Text Solution
|
- In a Young's double slit experiment, light of 500 nm is used to produc...
Text Solution
|
- A 750 Hz, 20 V source is connected to as resistance of 100 Omega an in...
Text Solution
|
- Magnitude of magnetic field (in SI units) at the centre of a hexagonal...
Text Solution
|