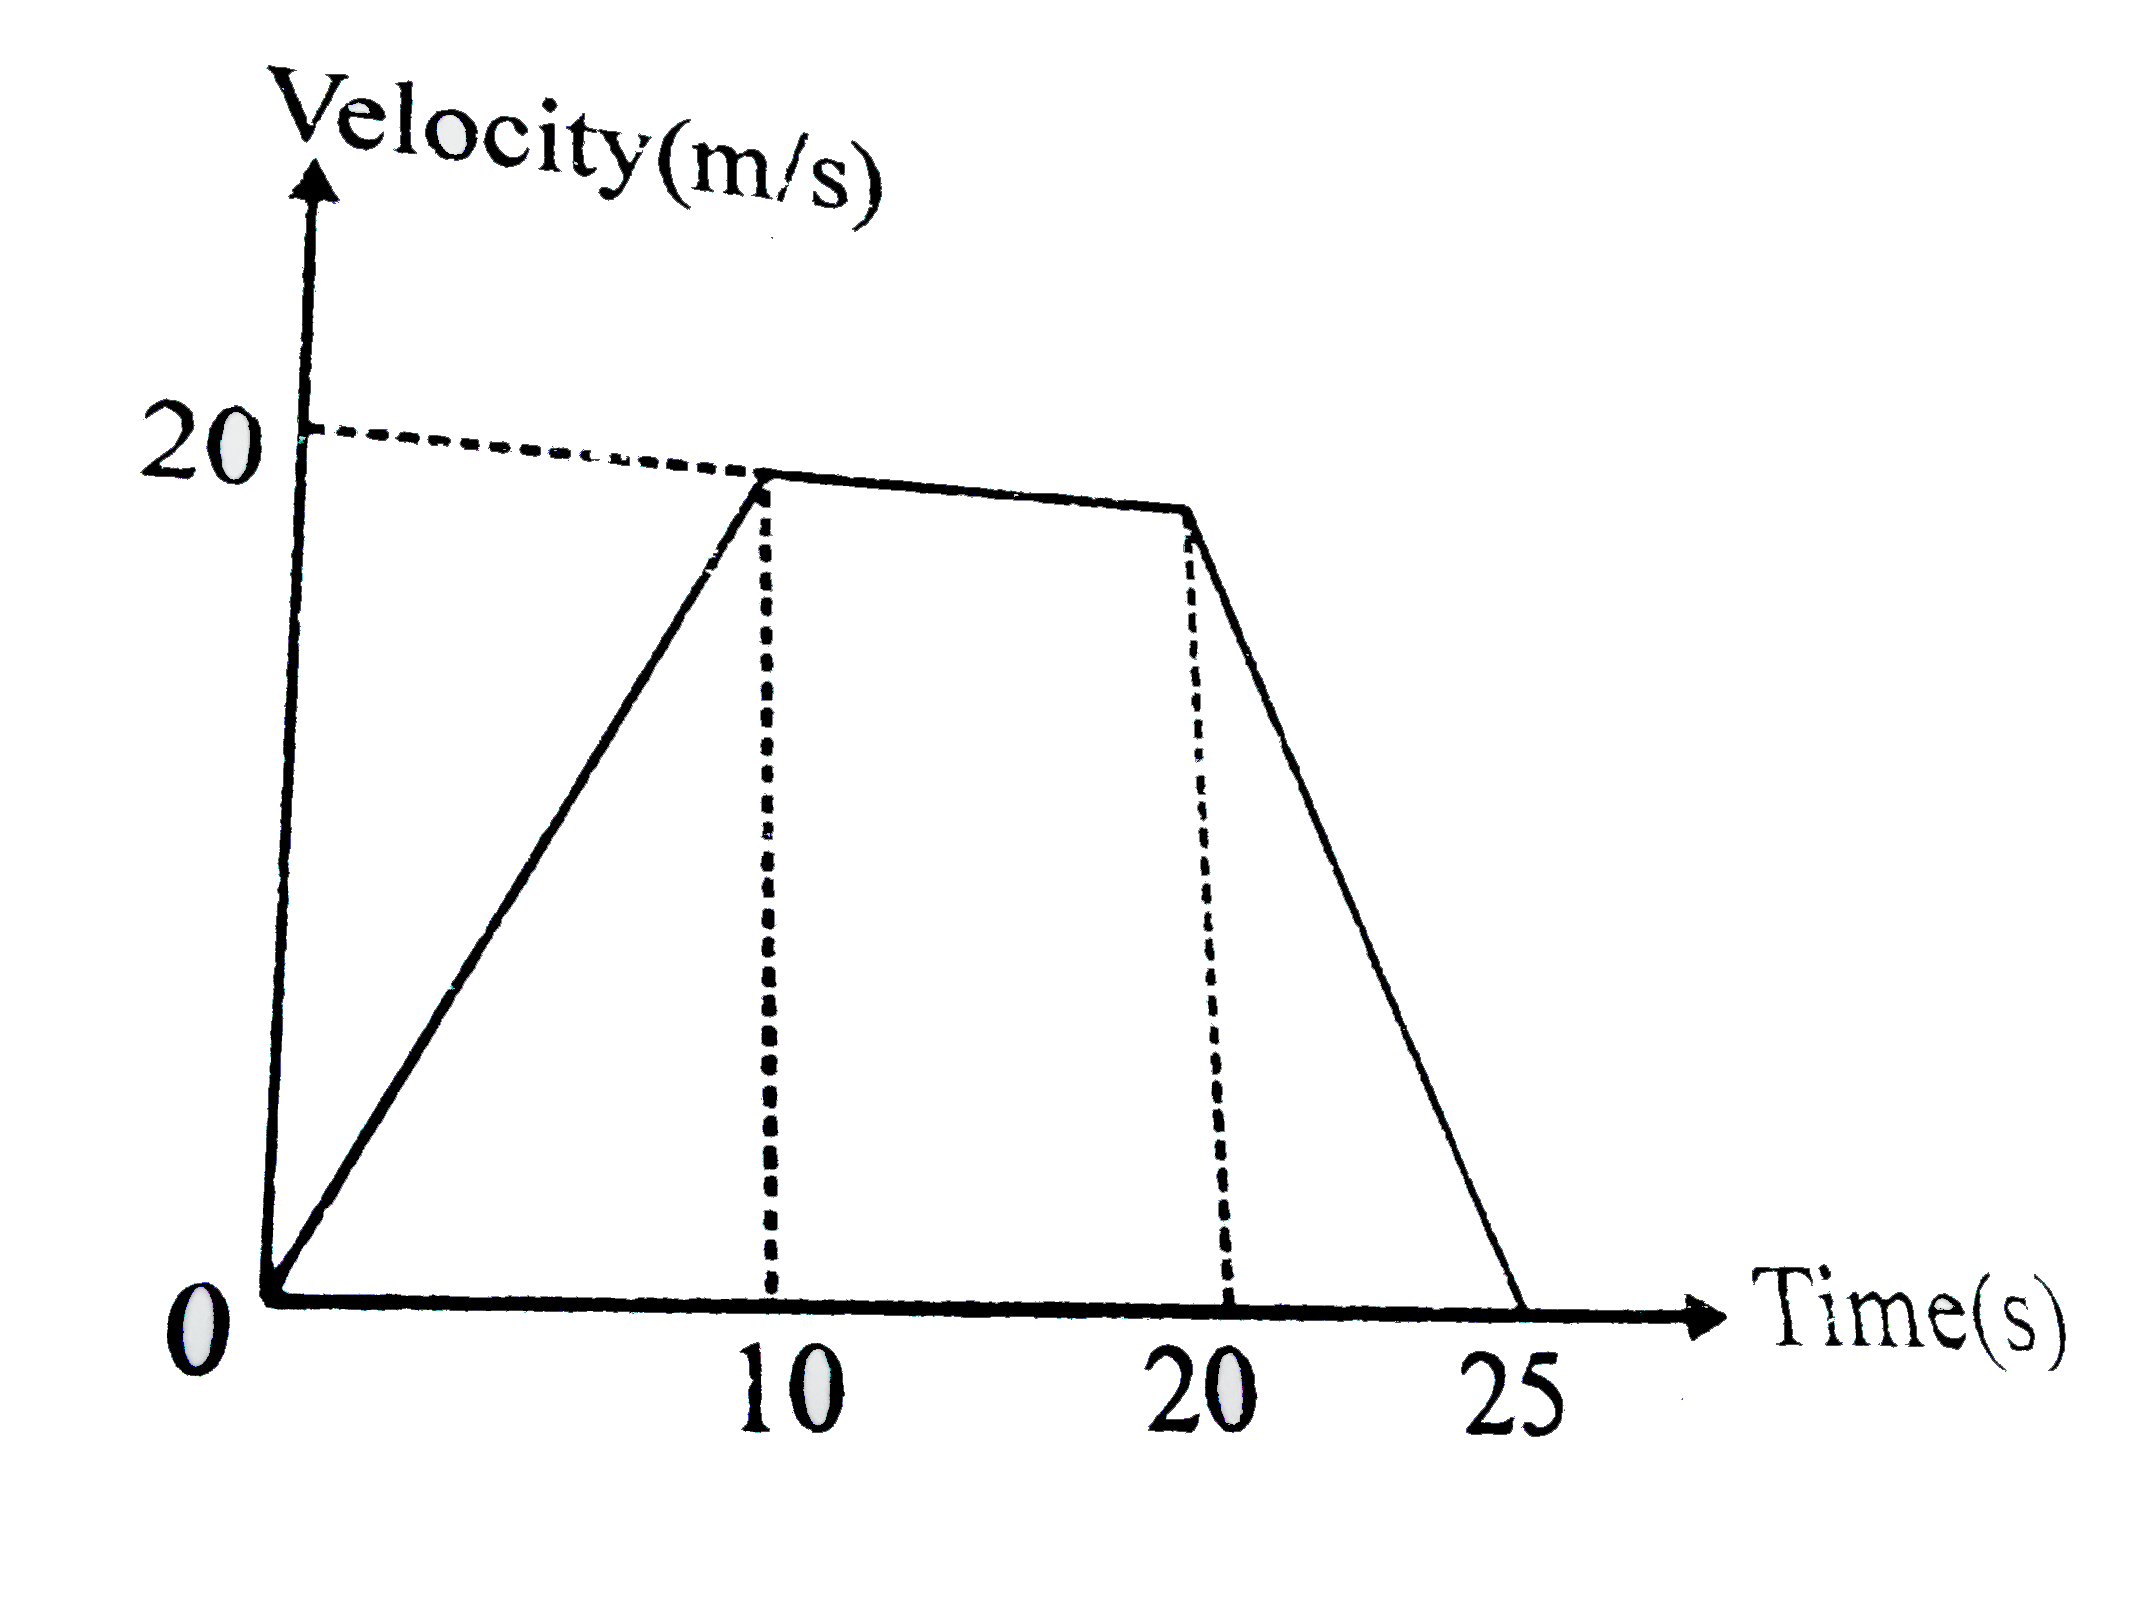
The velocity-time graph of a car moving along a straight road is shown in figure. The average velocity of the car is first 25 seconds is
The velocity-time graph of a body moving in a straight line is shown in the figure.
The velocity time graph of a body moving along a straight line is shown in figure. The ratio of the average velocities during the time t_1 and t_2 is.
The speed - time graph for a body moving along a straight line is shown in figure. The average acceleration of body may be
The velcocity displacement graph of a particle moving along a straight line is shown in figure. The velocity as function of x(0lexle1) is
Velocity displacement graph of a particle moving in a straight line is as shown in figure.
Figure shows the velocity time graph of a particle moving along straight line (v is m/s and t is in second). It average velocity in 20 seconds will be: .
The velocity-time graph of a particle moving along a straight line is shown in the figure-given below The displacement of the particle in 5 second is
The velocity - time graph of a particle moving along a straight line is shown in the figure given below The displacement of the particle in 5 second is