


Similar Questions
Explore conceptually related problems
Recommended Questions
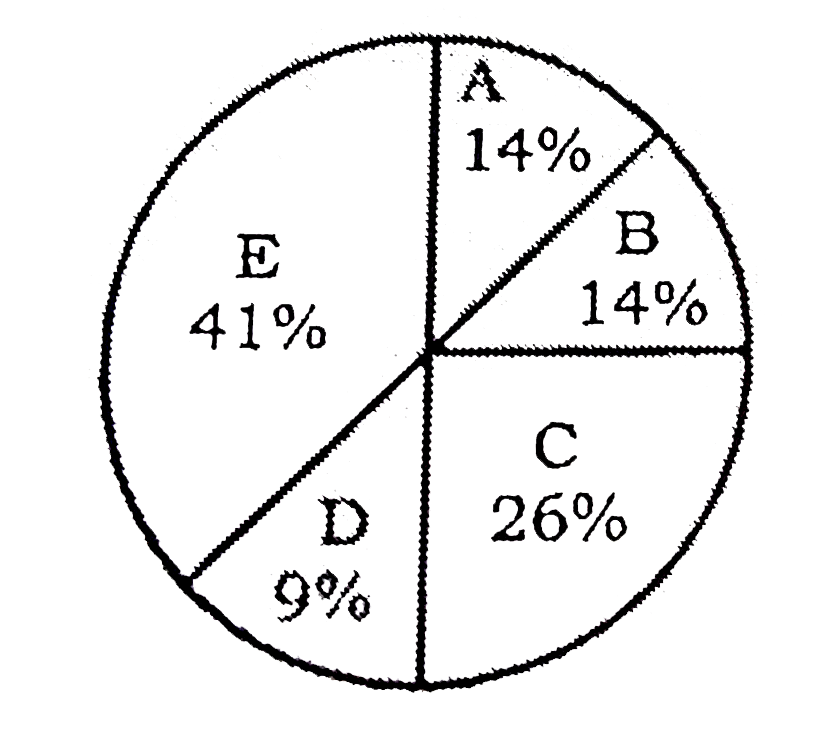
- निर्देश :- केंद्र सरकार द्वारा अर्जित राजस्व वृत्त चार्ट (पाई चार्ट ) ...
Text Solution
|
- Determine the point of symmetry of a regular hexagon. <img src="htt...
Text Solution
|
- Match the following Column A to Column B
Text Solution
|
- Match the following Column A to Column B
Text Solution
|
- Match the following Column A to Column B
Text Solution
|
- The inequation represented by the graph given below is : <img src="htt...
Text Solution
|
- The inequation that best describes the graph given below is <img src=...
Text Solution
|
- The inequation that best describes the following graph is <img src="h...
Text Solution
|
- Revision |पाई चार्ट या वृत्त आलेख
Text Solution
|