


Similar Questions
Explore conceptually related problems
Recommended Questions
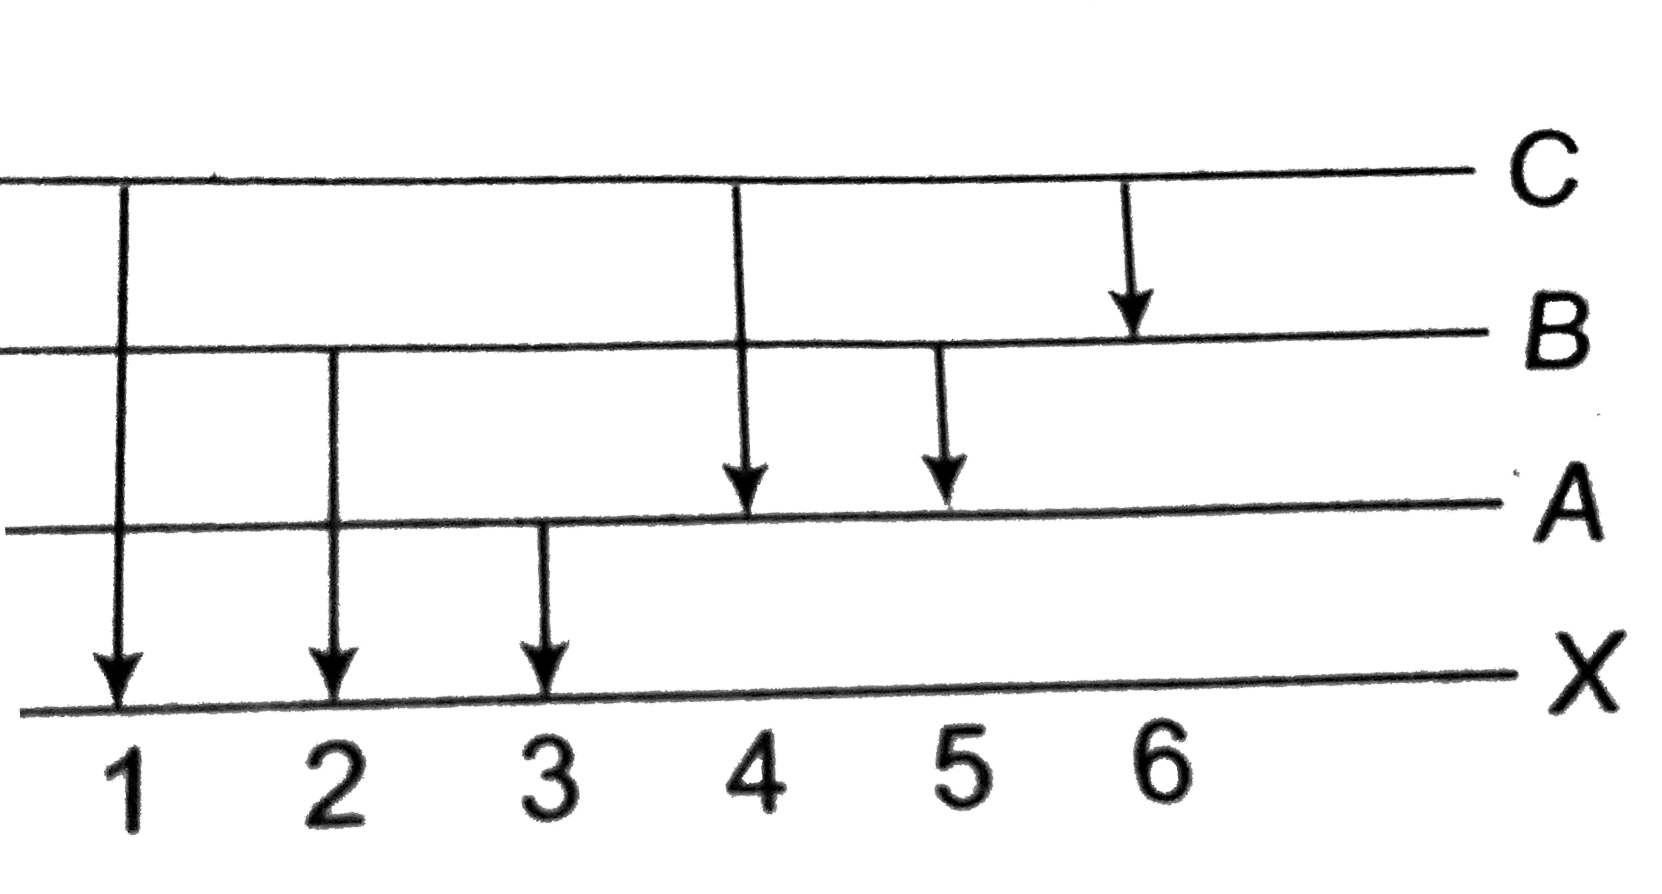
- The figure indicates the enegry level diagram of an atom and the origi...
Text Solution
|
- The figure indicates the enegry level diagram of an atom and the origi...
Text Solution
|
- The wavelength of the spectral line when the electron is the hydrogen ...
Text Solution
|
- Electrons in the H-atoms jumps from some higher level to 3rd energy le...
Text Solution
|
- चार ऊर्जा-स्तरों के बीच संक्रमण से उत्सर्जित स्पेक्ट्रमी रेखाओं की संख...
Text Solution
|
- हाइड्रोजन परमाणु के लिये बोहर की परिकल्पनाएँ लिखिए। बामर श्रेणी की स्प...
Text Solution
|
- हाइड्रोजन परमाणु को मूल स्तर से lambda=970Å के विकिरण द्वारा उत्तेजित ...
Text Solution
|
- The shortest wavelength spectral line in the brackett series of the sp...
Text Solution
|
- The wavelength of the spectral line, For the transition n = 2 to n=1 i...
Text Solution
|