


Similar Questions
Explore conceptually related problems
Recommended Questions
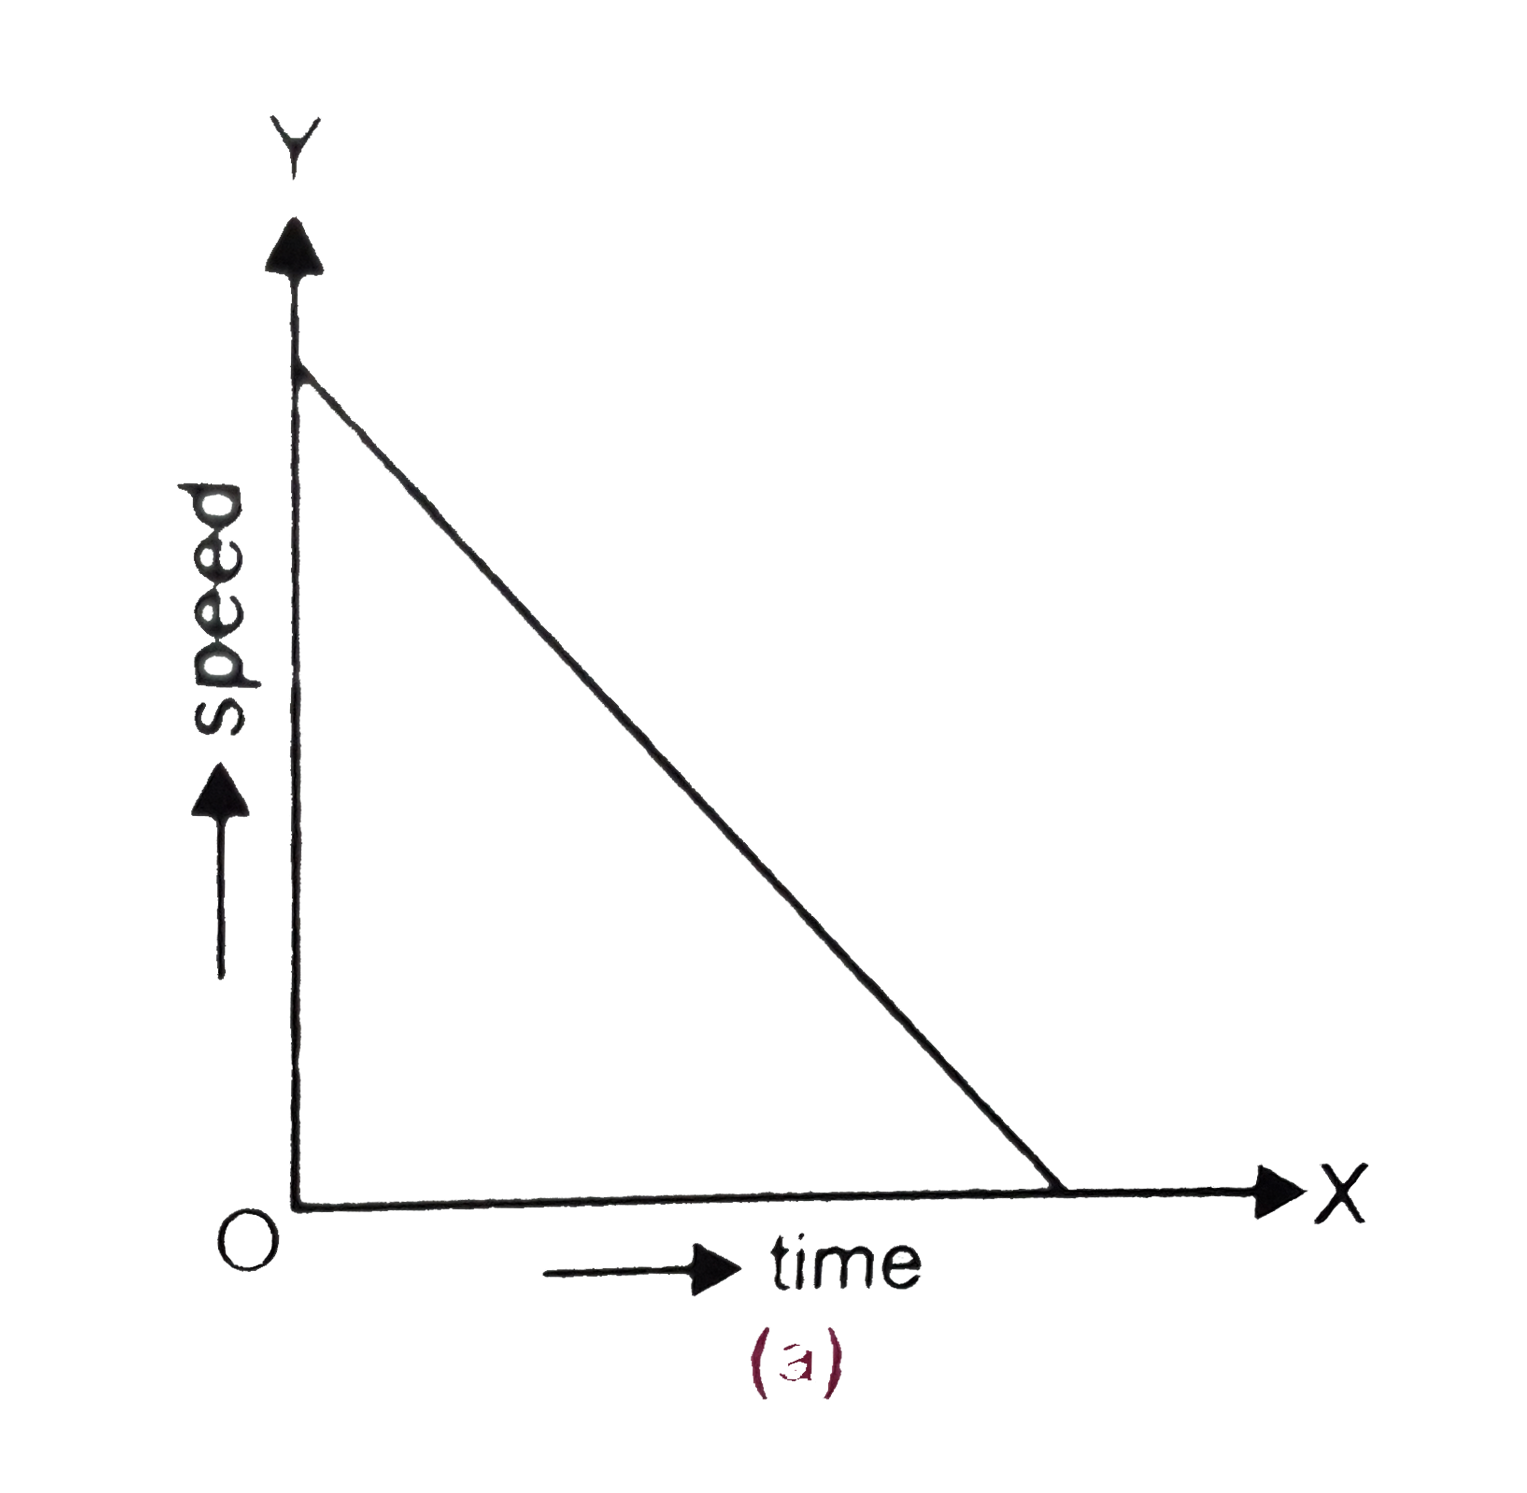
- What do the graph shown in Figure indicate ?
Text Solution
|
- If velocity-time graph of a body is as shown in figure, what is the na...
Text Solution
|
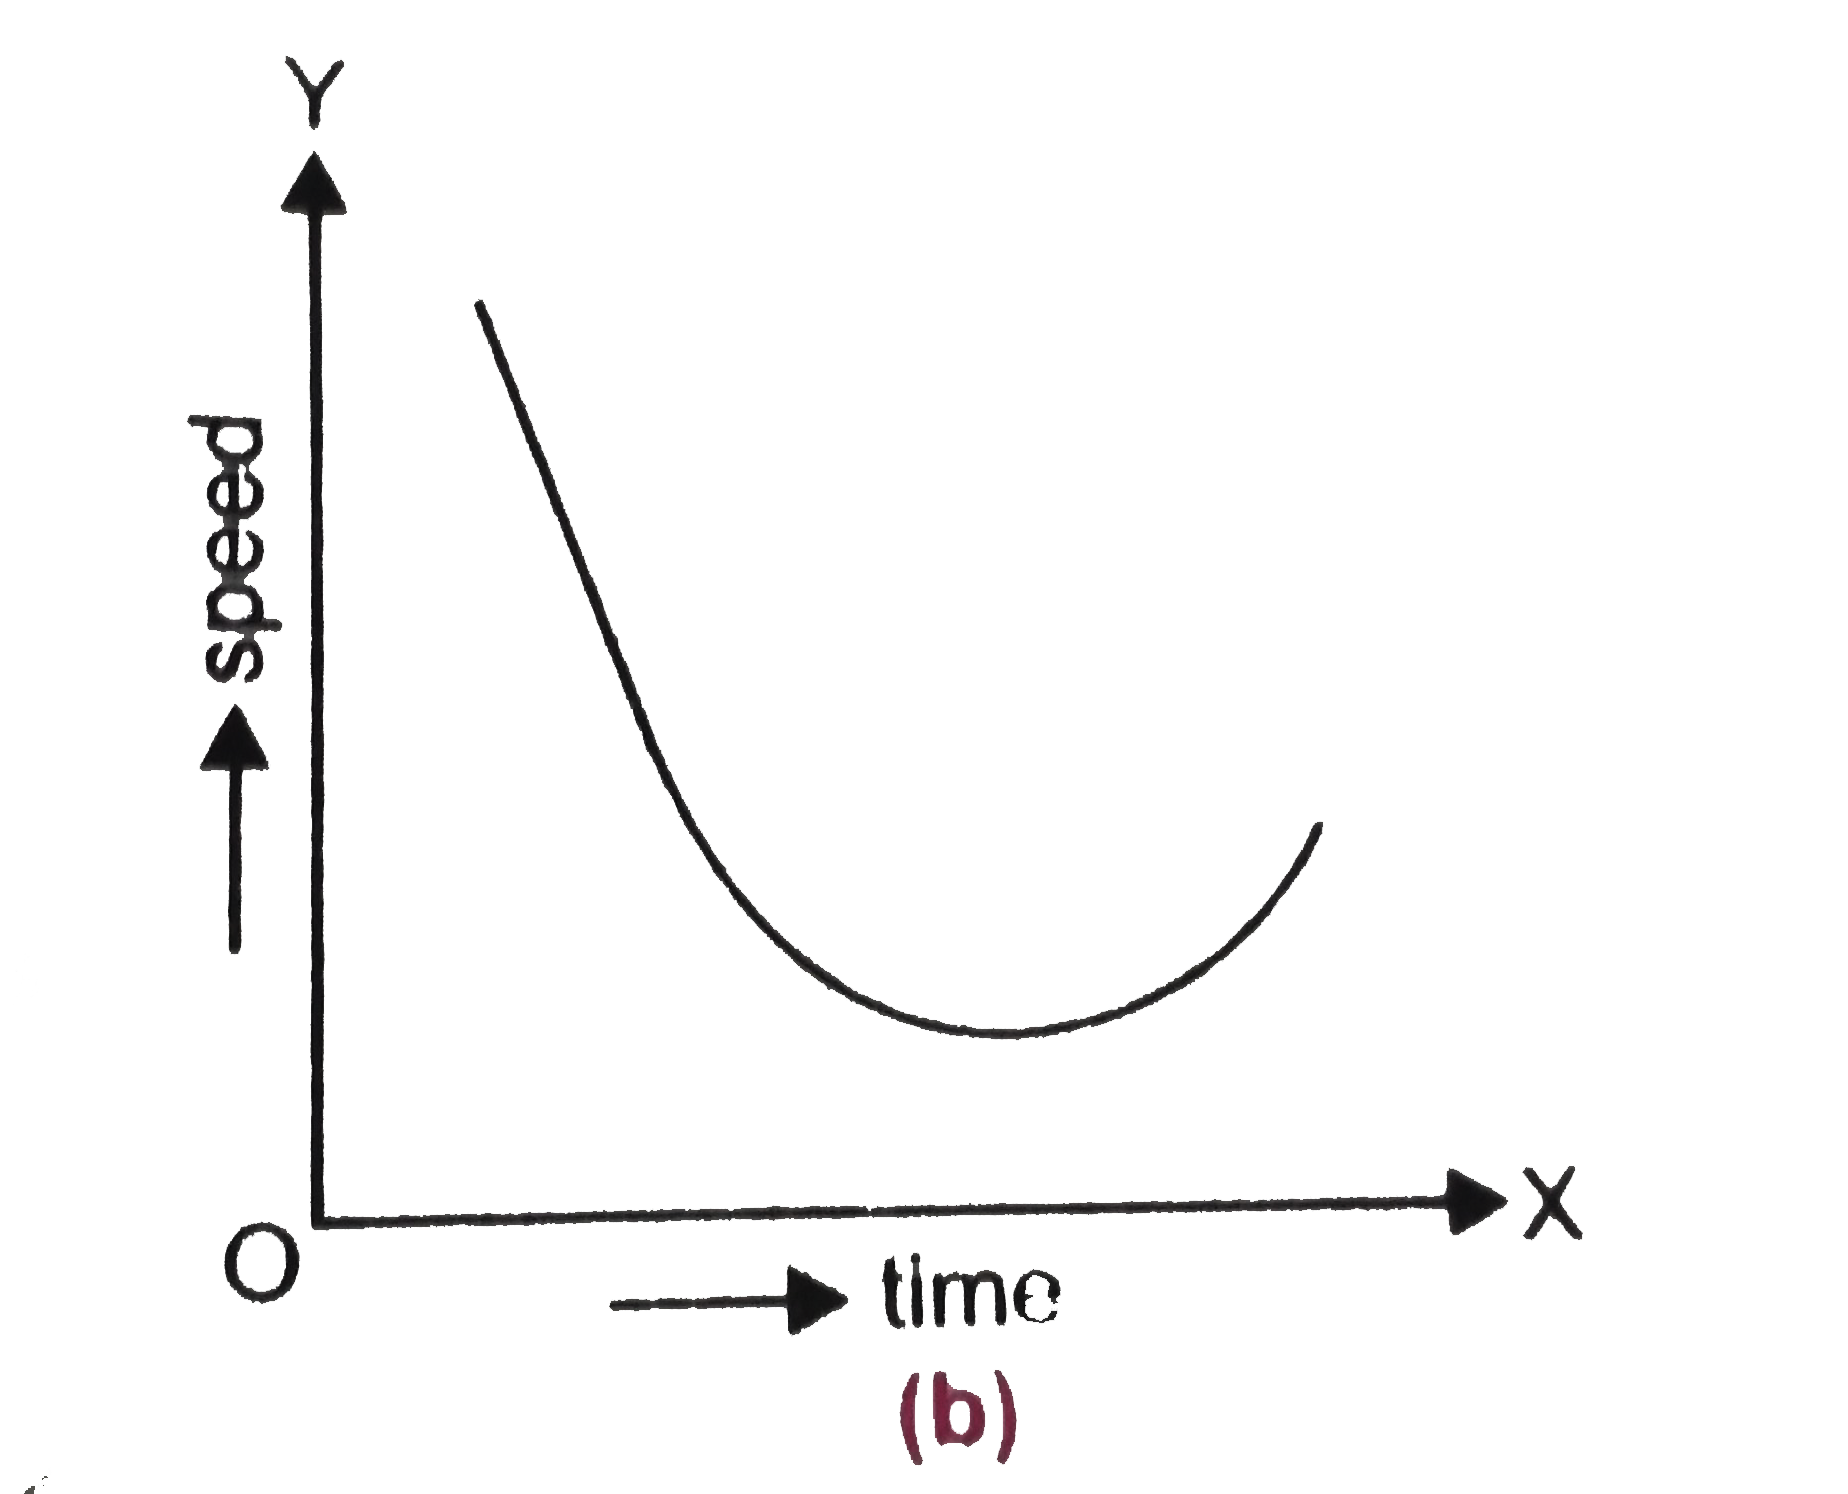
- What do the graph shown in Figure indicate ?
Text Solution
|
- The displacement-time graph of a particle is as shown below. It indica...
Text Solution
|
- The velocity time graph of a body is shown in fig. it indicates that :
Text Solution
|
- The heating curve of a paritcular substance in solid state is as shown...
Text Solution
|
- किसी वस्तु का चाल-समय ग्राफ संलग्न चित्र में प्रदर्शित है । ग्राफ से व...
Text Solution
|
- एक साइकिल सवार की यात्रा का वर्णन चित्र 3.38 में स्थिति - समय ग्राफ द्...
Text Solution
|
- किसी स्प्रिंग तुला का संकेतक पाठ्यांक व लोड ग्राफ , चित्र में दर्शाया ...
Text Solution
|