


Similar Questions
Explore conceptually related problems
Recommended Questions
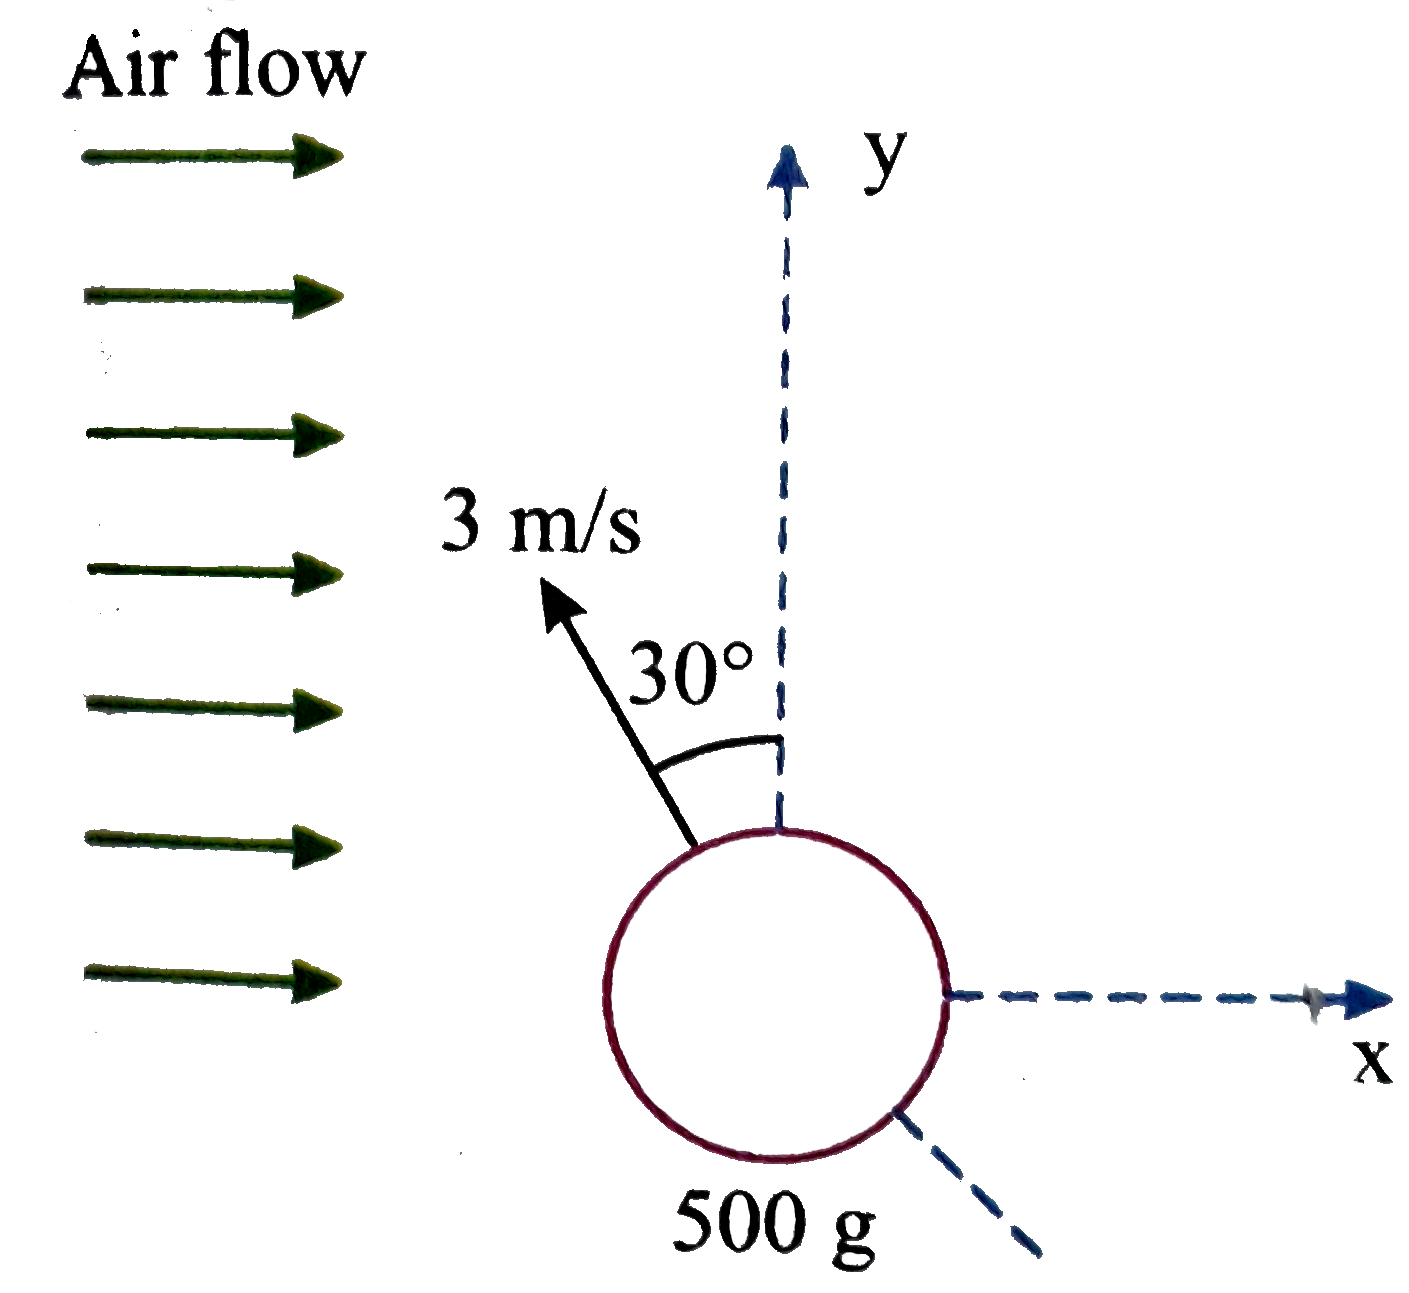
- Figure shows a sphere moving in a steady flow of air in the x-directio...
Text Solution
|
- A sphere of mass 1 kg rests at one corner of a cube. The cube is moved...
Text Solution
|
- A hollow sphere is completely filled with a liquid having a density rh...
Text Solution
|
- Three small spheres x,y, and z carry charges of equal magnitudes and w...
Text Solution
|
- Four solid spheres are made to move on a rough horizontal surface. Sph...
Text Solution
|
- Figure shows a sphere moving in a steady flow of air in the x -directi...
Text Solution
|
- In the following figure, a sphere of radius 3m rolls on a plank. The a...
Text Solution
|
- An object is moving in x-y plane its velocity and acceleration at t=0 ...
Text Solution
|
- A solid sphere is rotating about an axis as shown in figure. An insect...
Text Solution
|