


NEET PREVIOUS YEAR (YEARWISE + CHAPTERWISE)-NEET 2020-All Questions
- Light with an average flux of 20 W/cm^2 falls on a non-reflecting surf...
Text Solution
|
- For transistor action, which of the following statements are correct ?
Text Solution
|
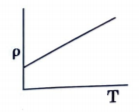
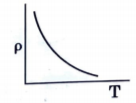
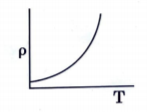
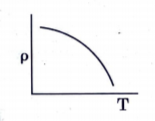
- which of the following graph represents the variation of resistivity (...
Text Solution
|
- In certain region of space with volume 0.2 m^3 the electric potential ...
Text Solution
|
- For the logic circuit shown the truth table is
Text Solution
|
- A 40 micro F capacitor is connected to a 200V, 50 Hz ac supply. Rms va...
Text Solution
|
- A cylinder contains hydrogen gas at pressure of 249 kPa and temperatur...
Text Solution
|
- Taking into account of significant figures what is value of 9.99m - 0....
Text Solution
|
- The mean free path for gas with molecular diameter d and number densit...
Text Solution
|
- An iron rod of susceptiblity 599 is subjected to a magnetising field o...
Text Solution
|
- A short electric dipole has dipole moment of 16 x 10^-9 C m. The elect...
Text Solution
|
- A body weighs 72N on surface of earth what is gravitational force on i...
Text Solution
|
- The solids which have negative temperature coefficient of resistance a...
Text Solution
|
- Light of frequency 1.5 times the threshold frequency is incident on a ...
Text Solution
|
- A seriesLCR circuit is connected to an ac voltage source. When L is re...
Text Solution
|
- A spherical conductor of radius 10 cm has a charge of 3.2 x 10^-7 C di...
Text Solution
|
- Find the torque about the origin when a force of 3 hatj N acts on a pa...
Text Solution
|
- A charged particle having drift velocity of 7.5 x 10^-4 m/s in an elec...
Text Solution
|
- A ray is incident at an angle of incidence i on one surfcae of a small...
Text Solution
|
- The quantities of heat required to raise the temperature of two solid ...
Text Solution
|