Text Solution
Verified by Experts


Similar Questions
Explore conceptually related problems
Recommended Questions
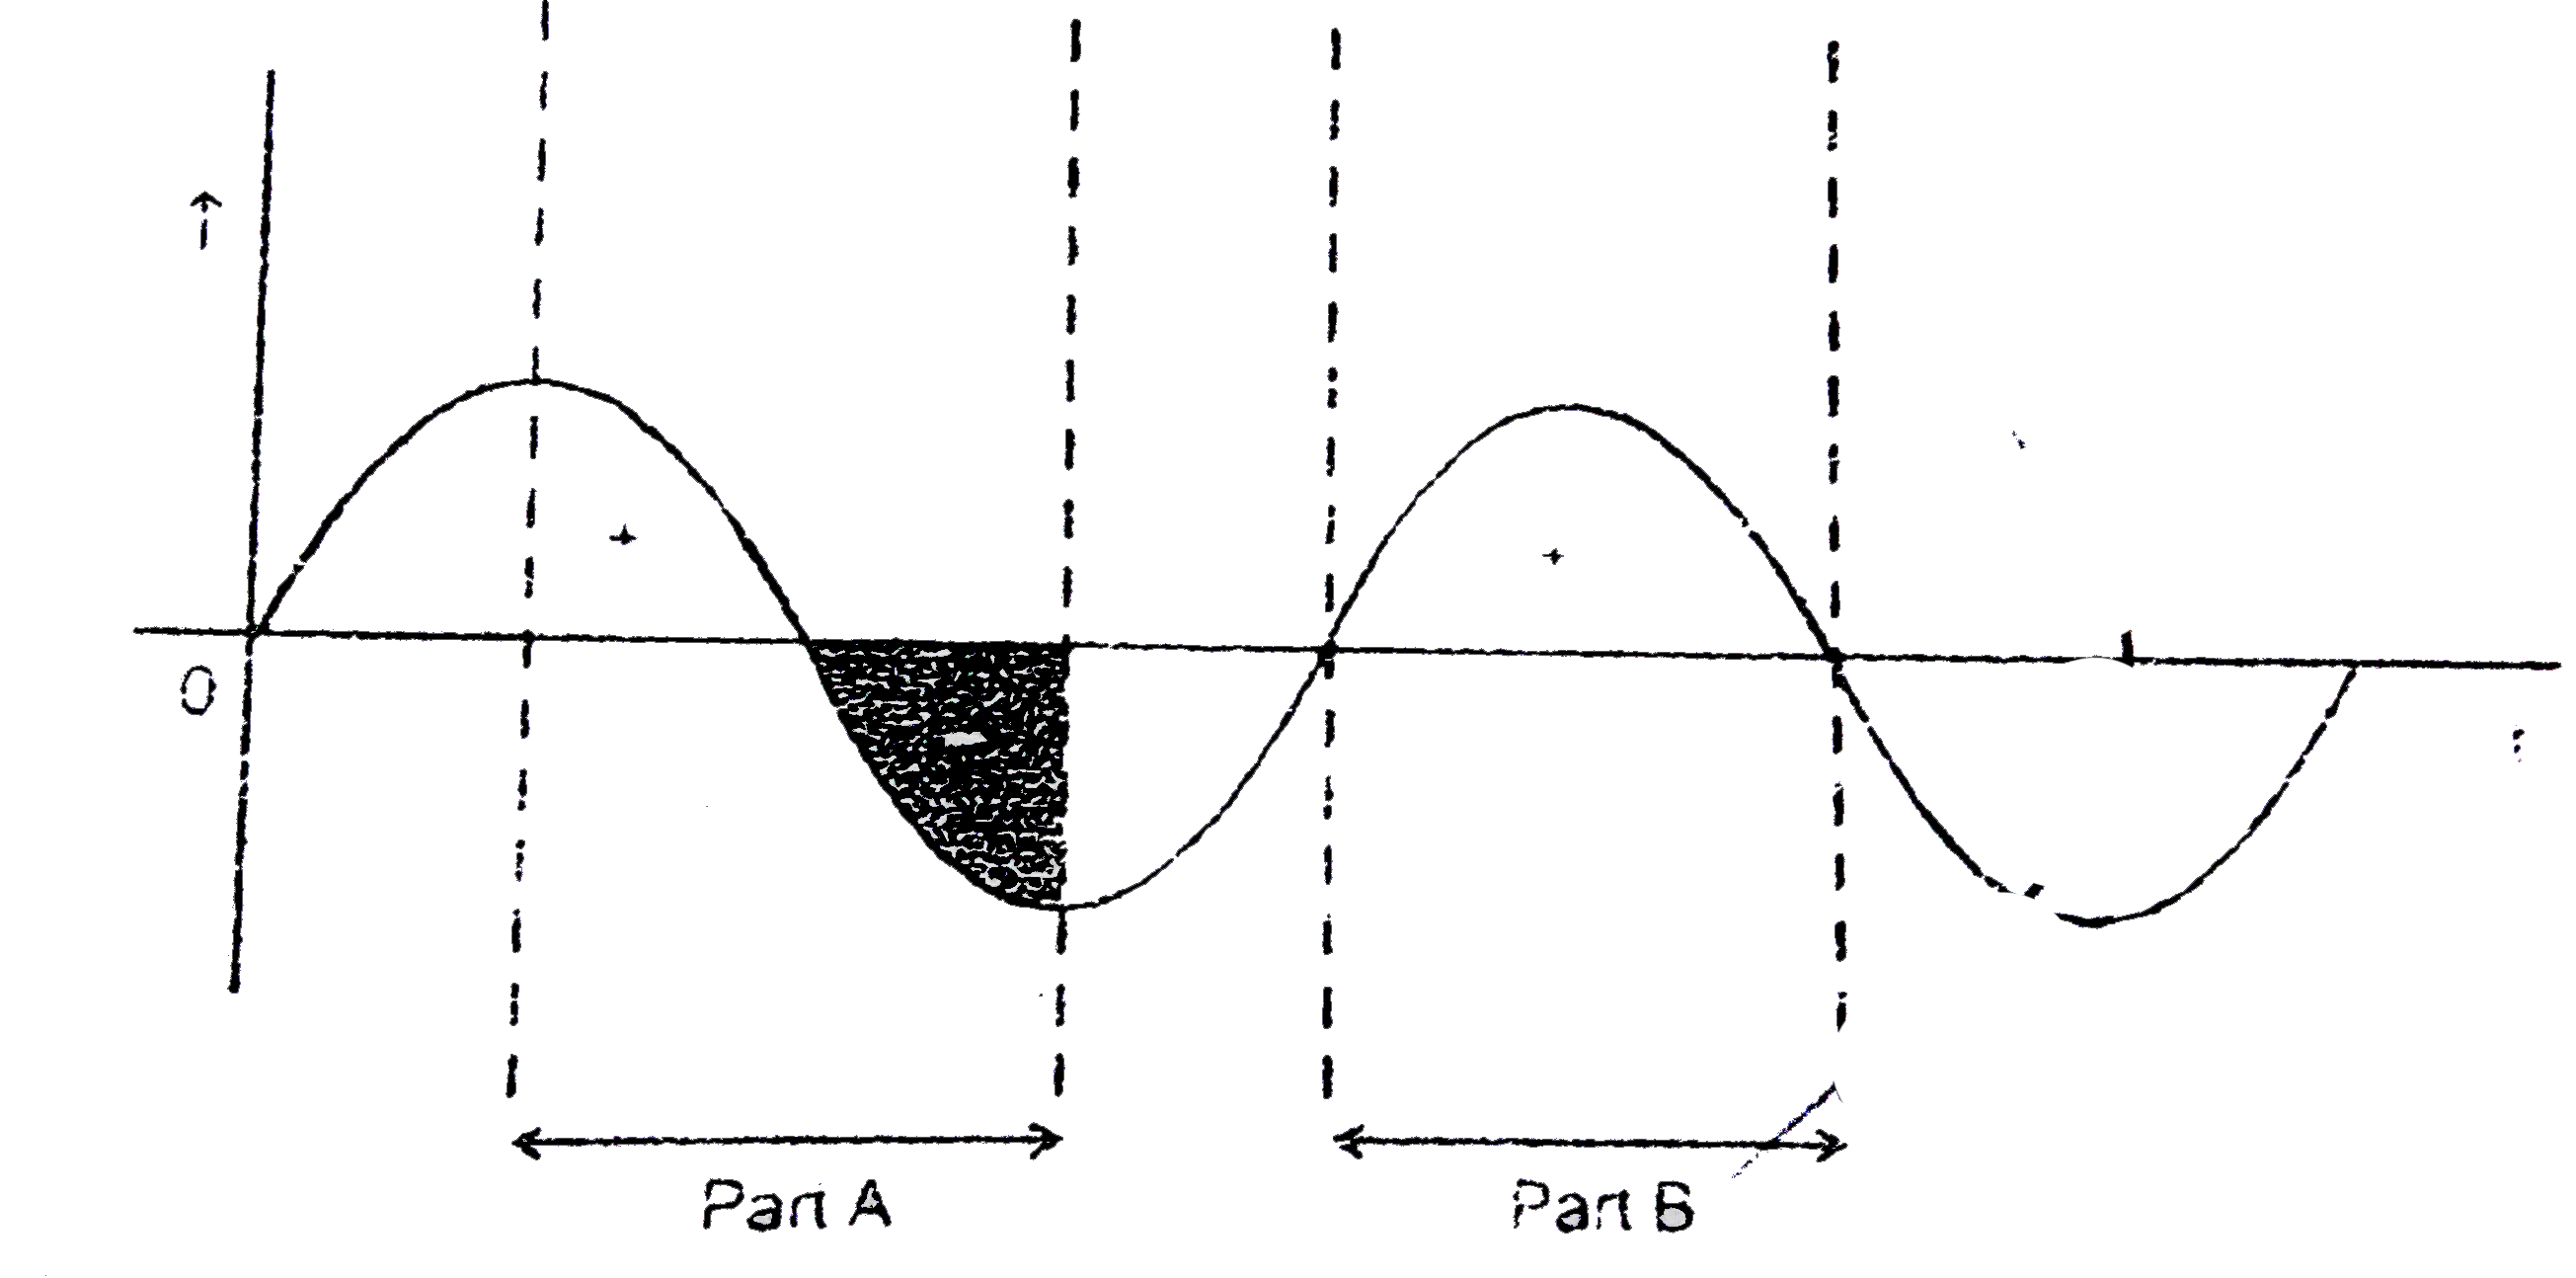
- Show graphically that the average of sinusoidally varying current in h...
Text Solution
|
- Show graphically that the average of simusoidally varying current in h...
Text Solution
|
- Assertion (A) : If current varies sinusoidally the average power consu...
Text Solution
|
- Assertion : An object may have varying speed without having varying ve...
Text Solution
|
- दिखाईये कि एक पुरे चक्र के लिए प्रत्यावर्ती धारा का औसत मान शून्य होता...
Text Solution
|
- एक पूर्ण चक्र में प्रत्यावर्ती धारा का औसत मान शून्य होता है। (सत्य/अस...
Text Solution
|
- Statement-I: Average of sinusoidal A.C. can never be zero for half cyc...
Text Solution
|
- एक पूर्ण चक्र के लिए तथा प्रत्येक अर्द्ध - चक्र के लिए प्रत्यावर्ती धा...
Text Solution
|
- The average velocity of an object is zero but the average velocity may...
Text Solution
|