


Similar Questions
Explore conceptually related problems
Recommended Questions
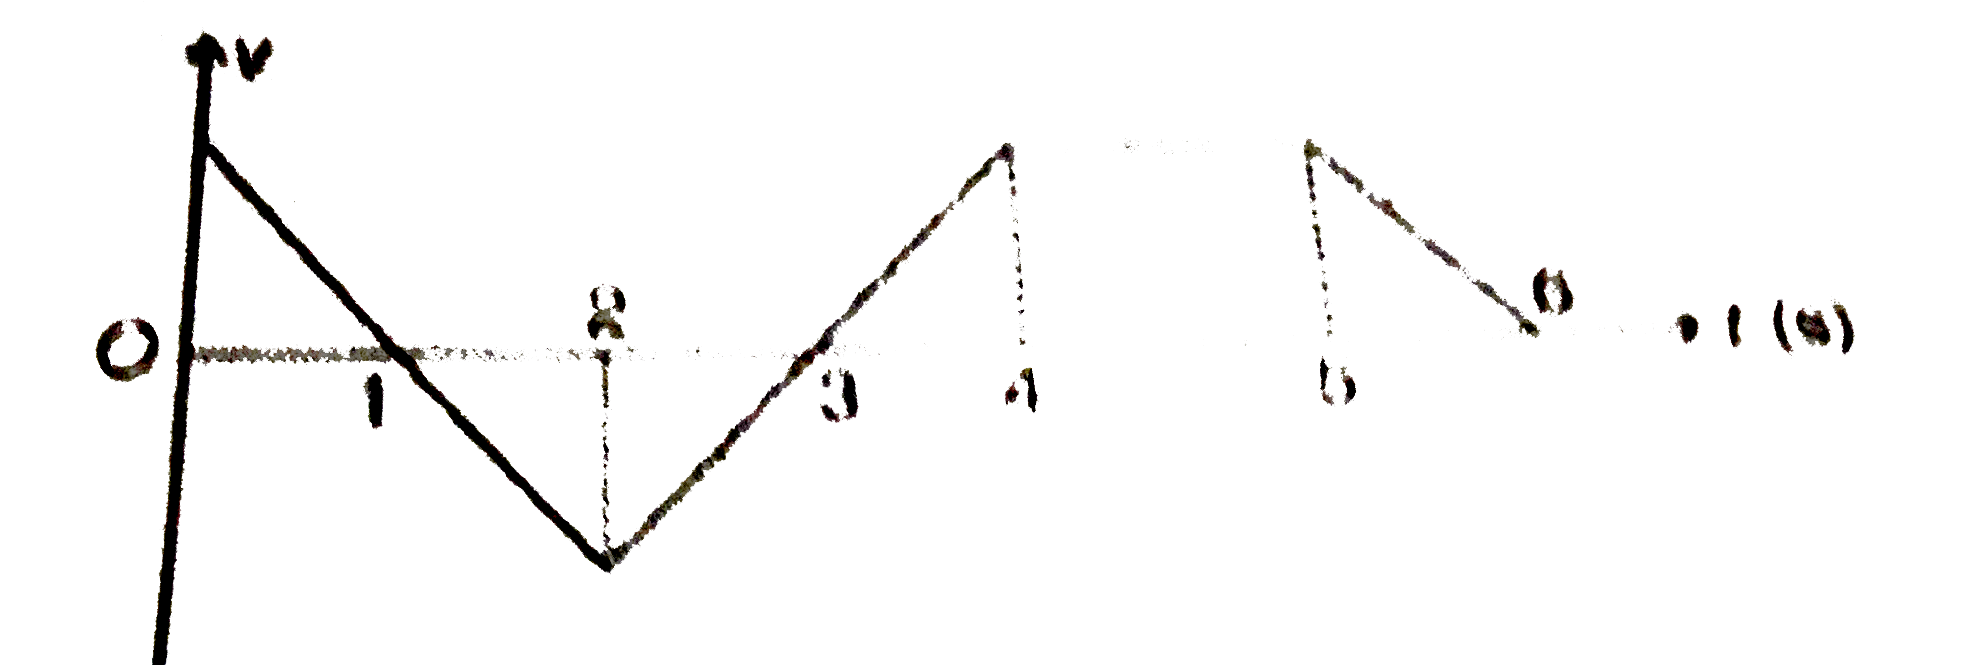
- From v-t graph shown in figure. We can draw the following conclusions
Text Solution
|
- From the given v - t graph (Figure), it can be inferred that the objec...
Text Solution
|
- From v-t graph shown in figure. We can draw the following conclusions
Text Solution
|
- In the V-T graph shown in figure match the following.
Text Solution
|
- From the given v-t graph (see figure), it can be inferred that the obj...
Text Solution
|
- In the V-T graph shown in the figure match the following columns.
Text Solution
|
- What conclusion can you draw about the velocity of a body from the dis...
Text Solution
|
- What conclusion can you draw about the acceleration of a body from the...
Text Solution
|
- What conclusion can you draw about the acceleration of a body from the...
Text Solution
|