Text Solution
Verified by Experts


Topper's Solved these Questions
Similar Questions
Explore conceptually related problems
CENGAGE-GRAPHS OF ELEMENTARY FUNCTIONS -Exercise
- (a) Draw the graph of f(x) = ={{:(1",",, |x| ge 1), ((1)/(n^(2)) ",",,...
Text Solution
|
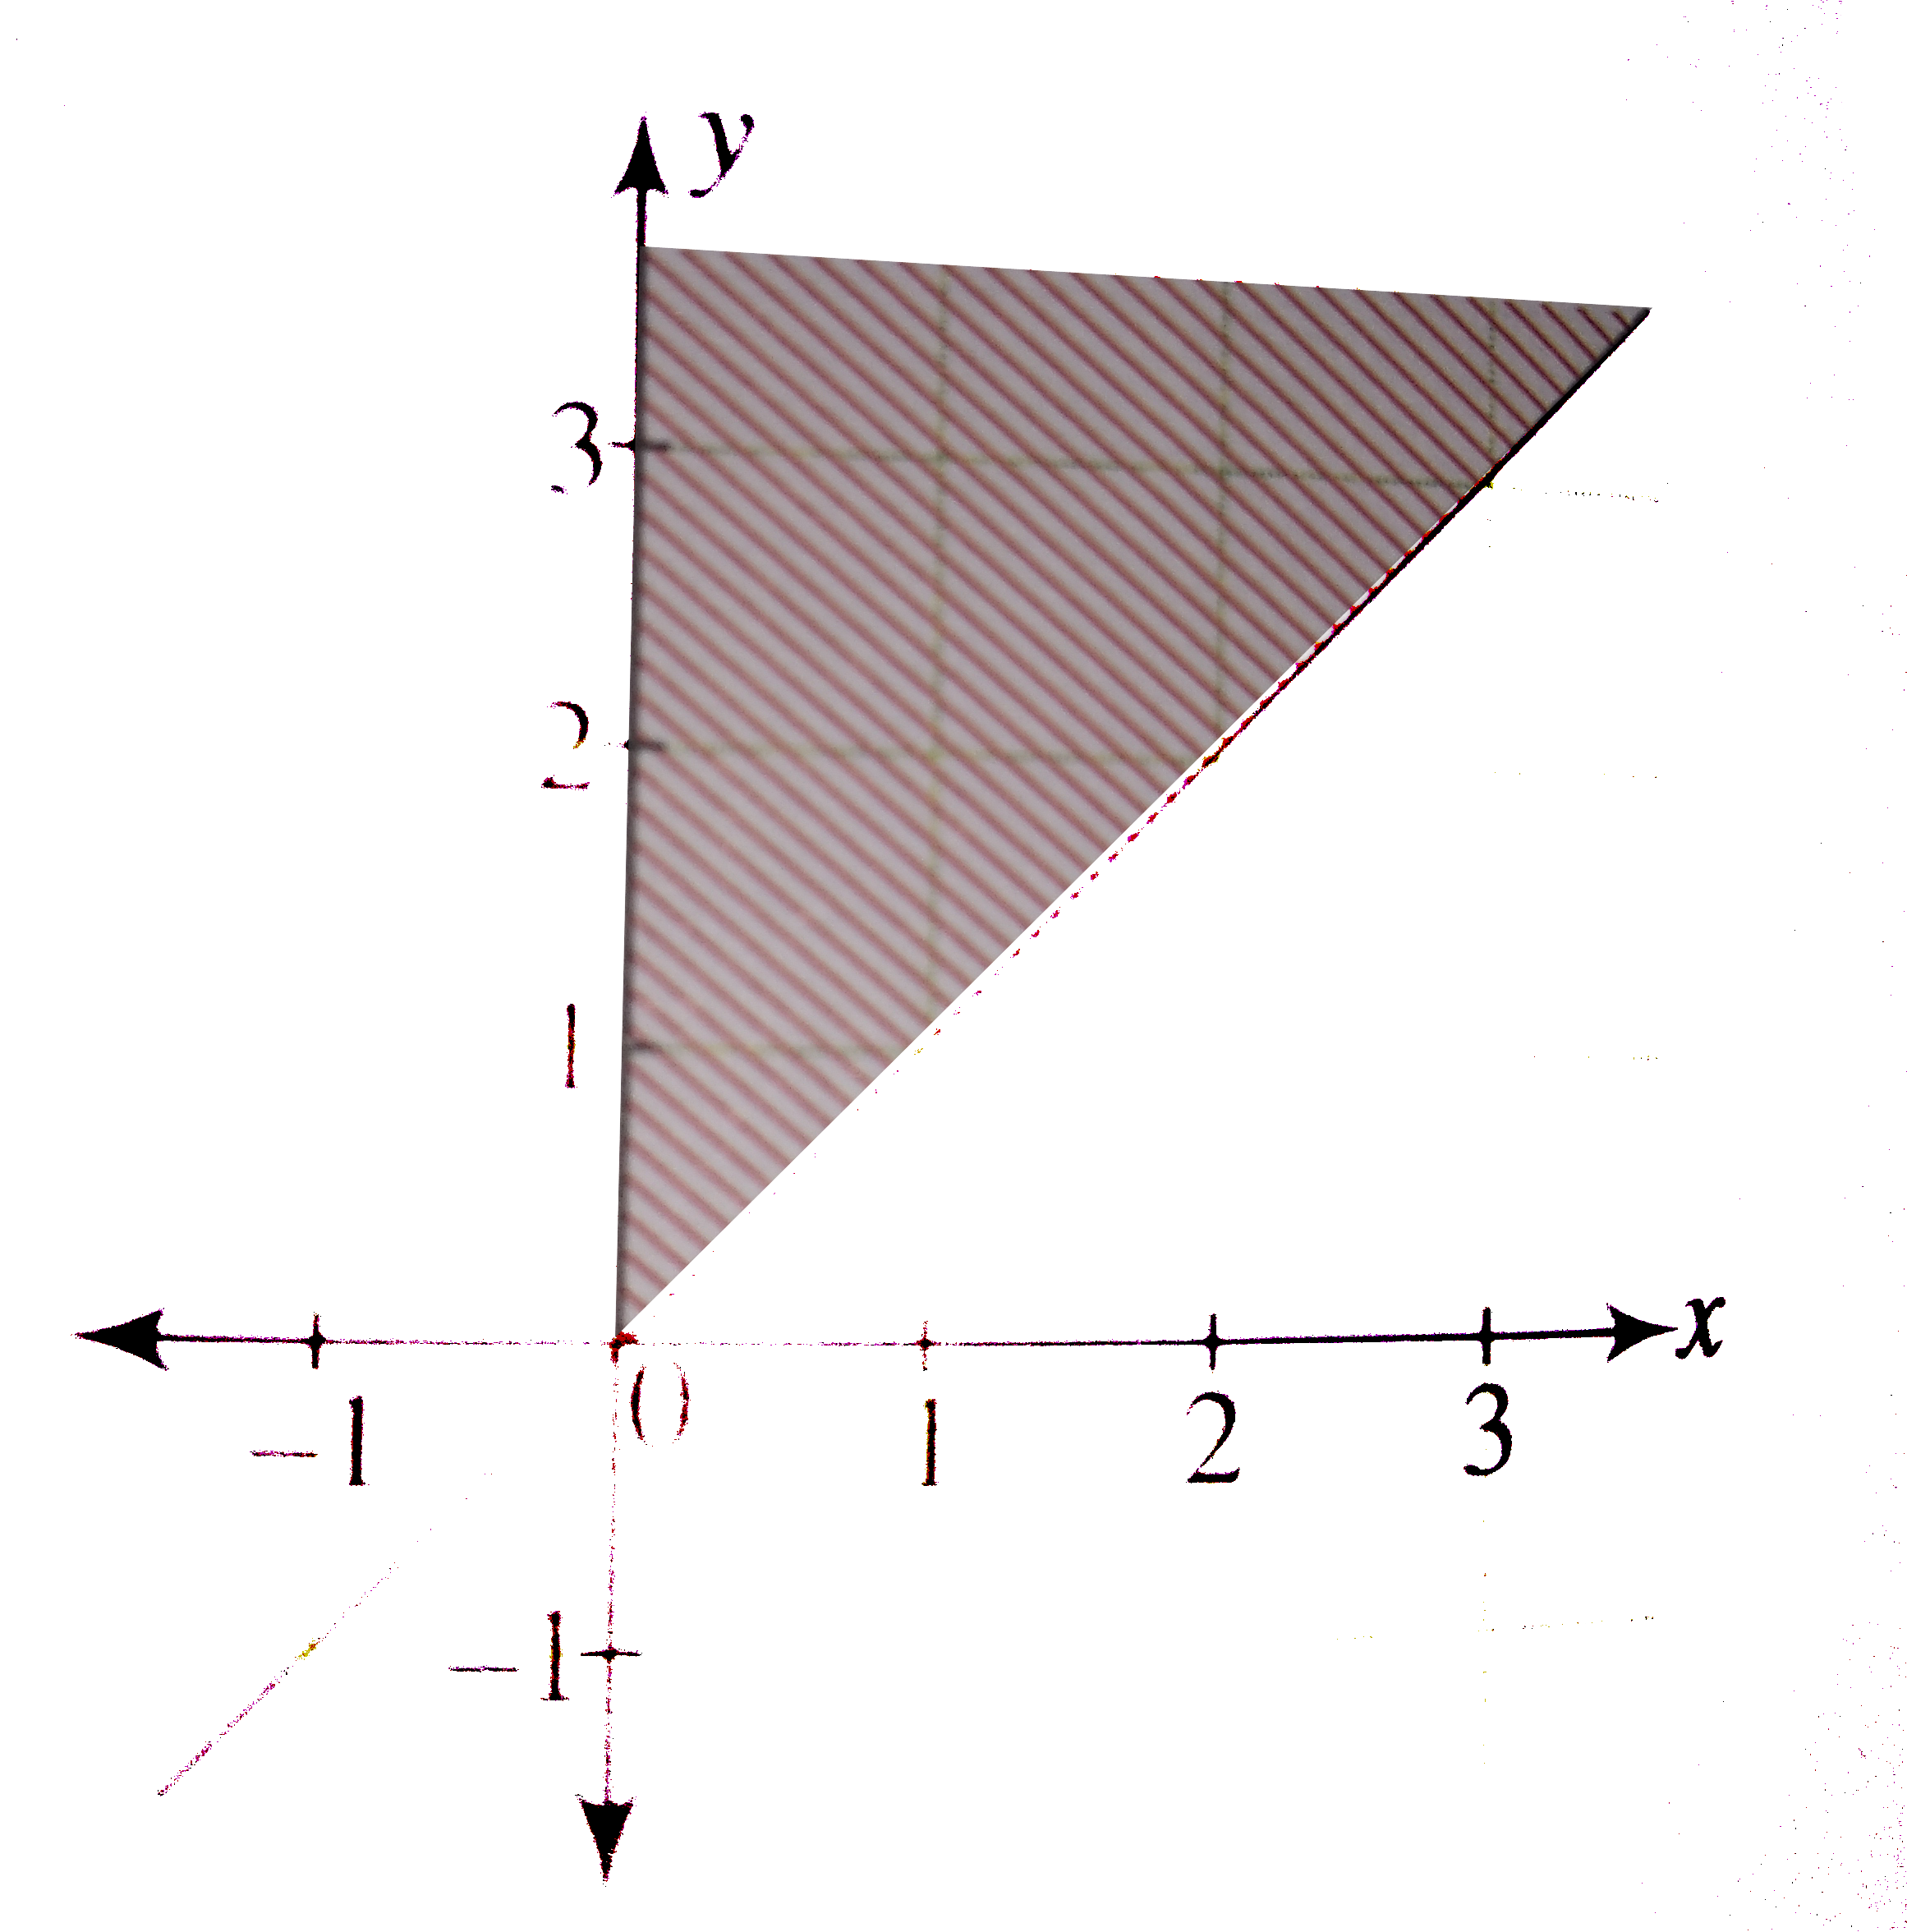
- Sketch the regions which points satisfy |x+y| ge 2.
Text Solution
|
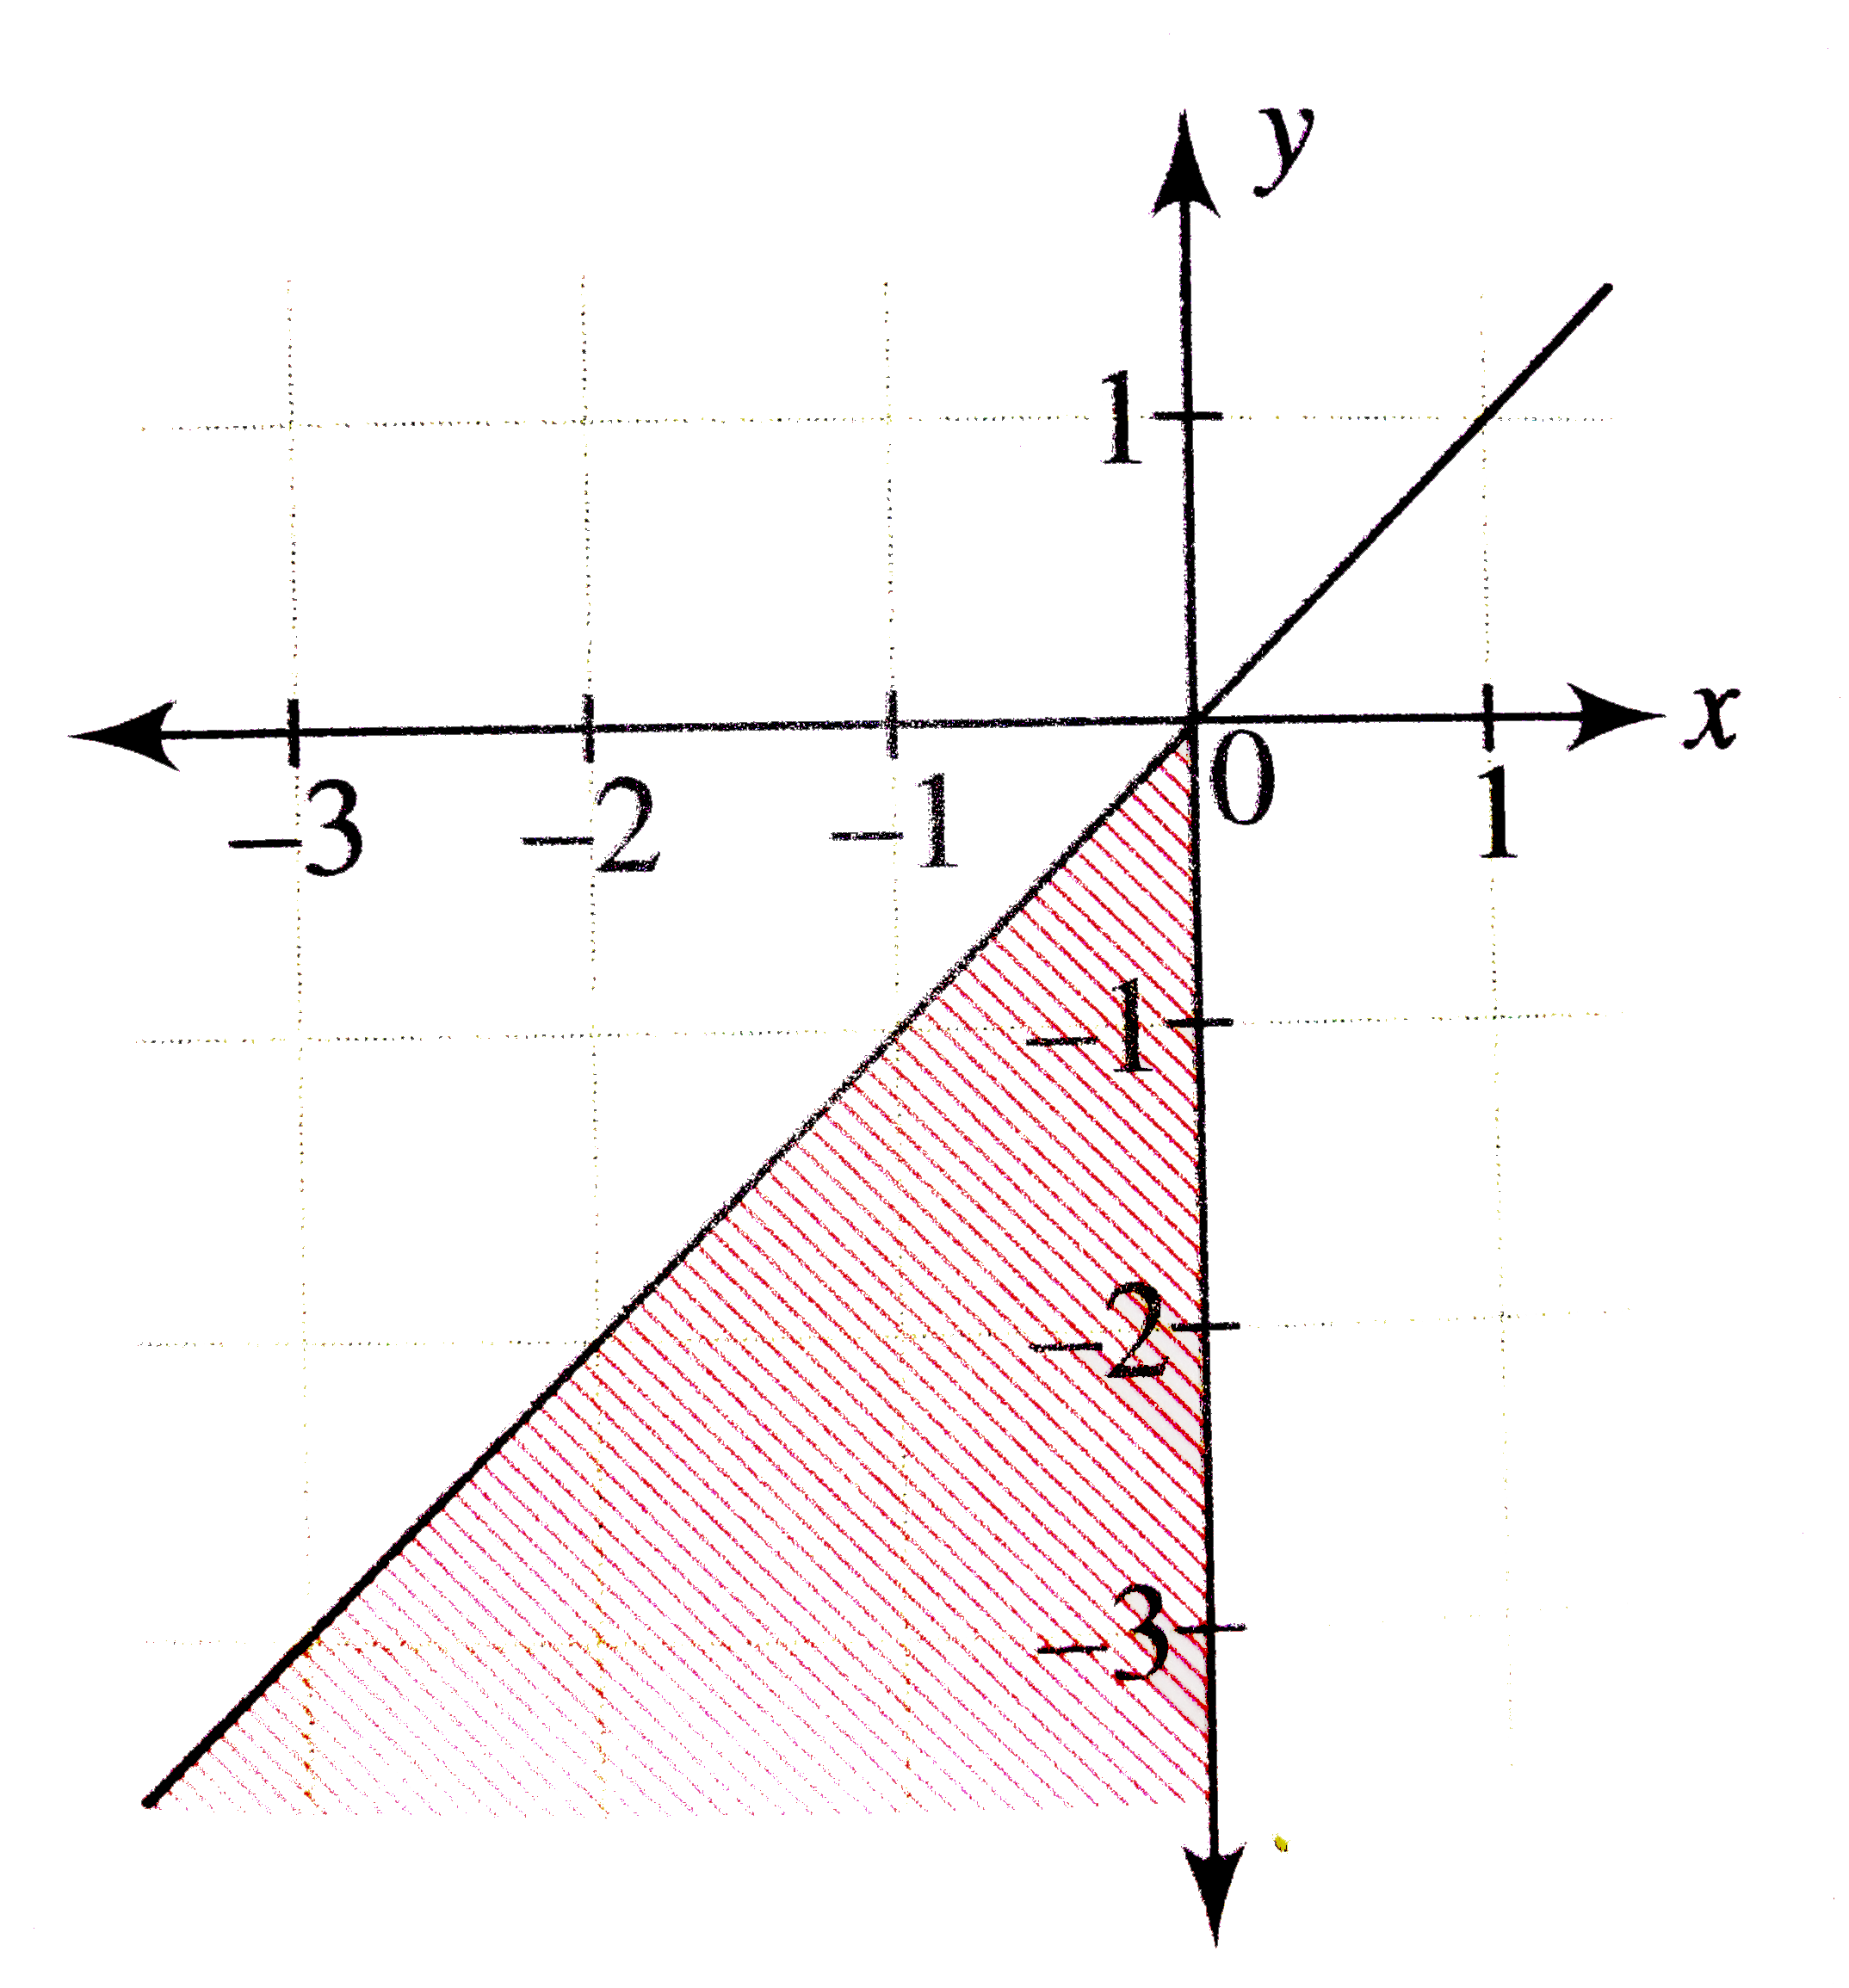
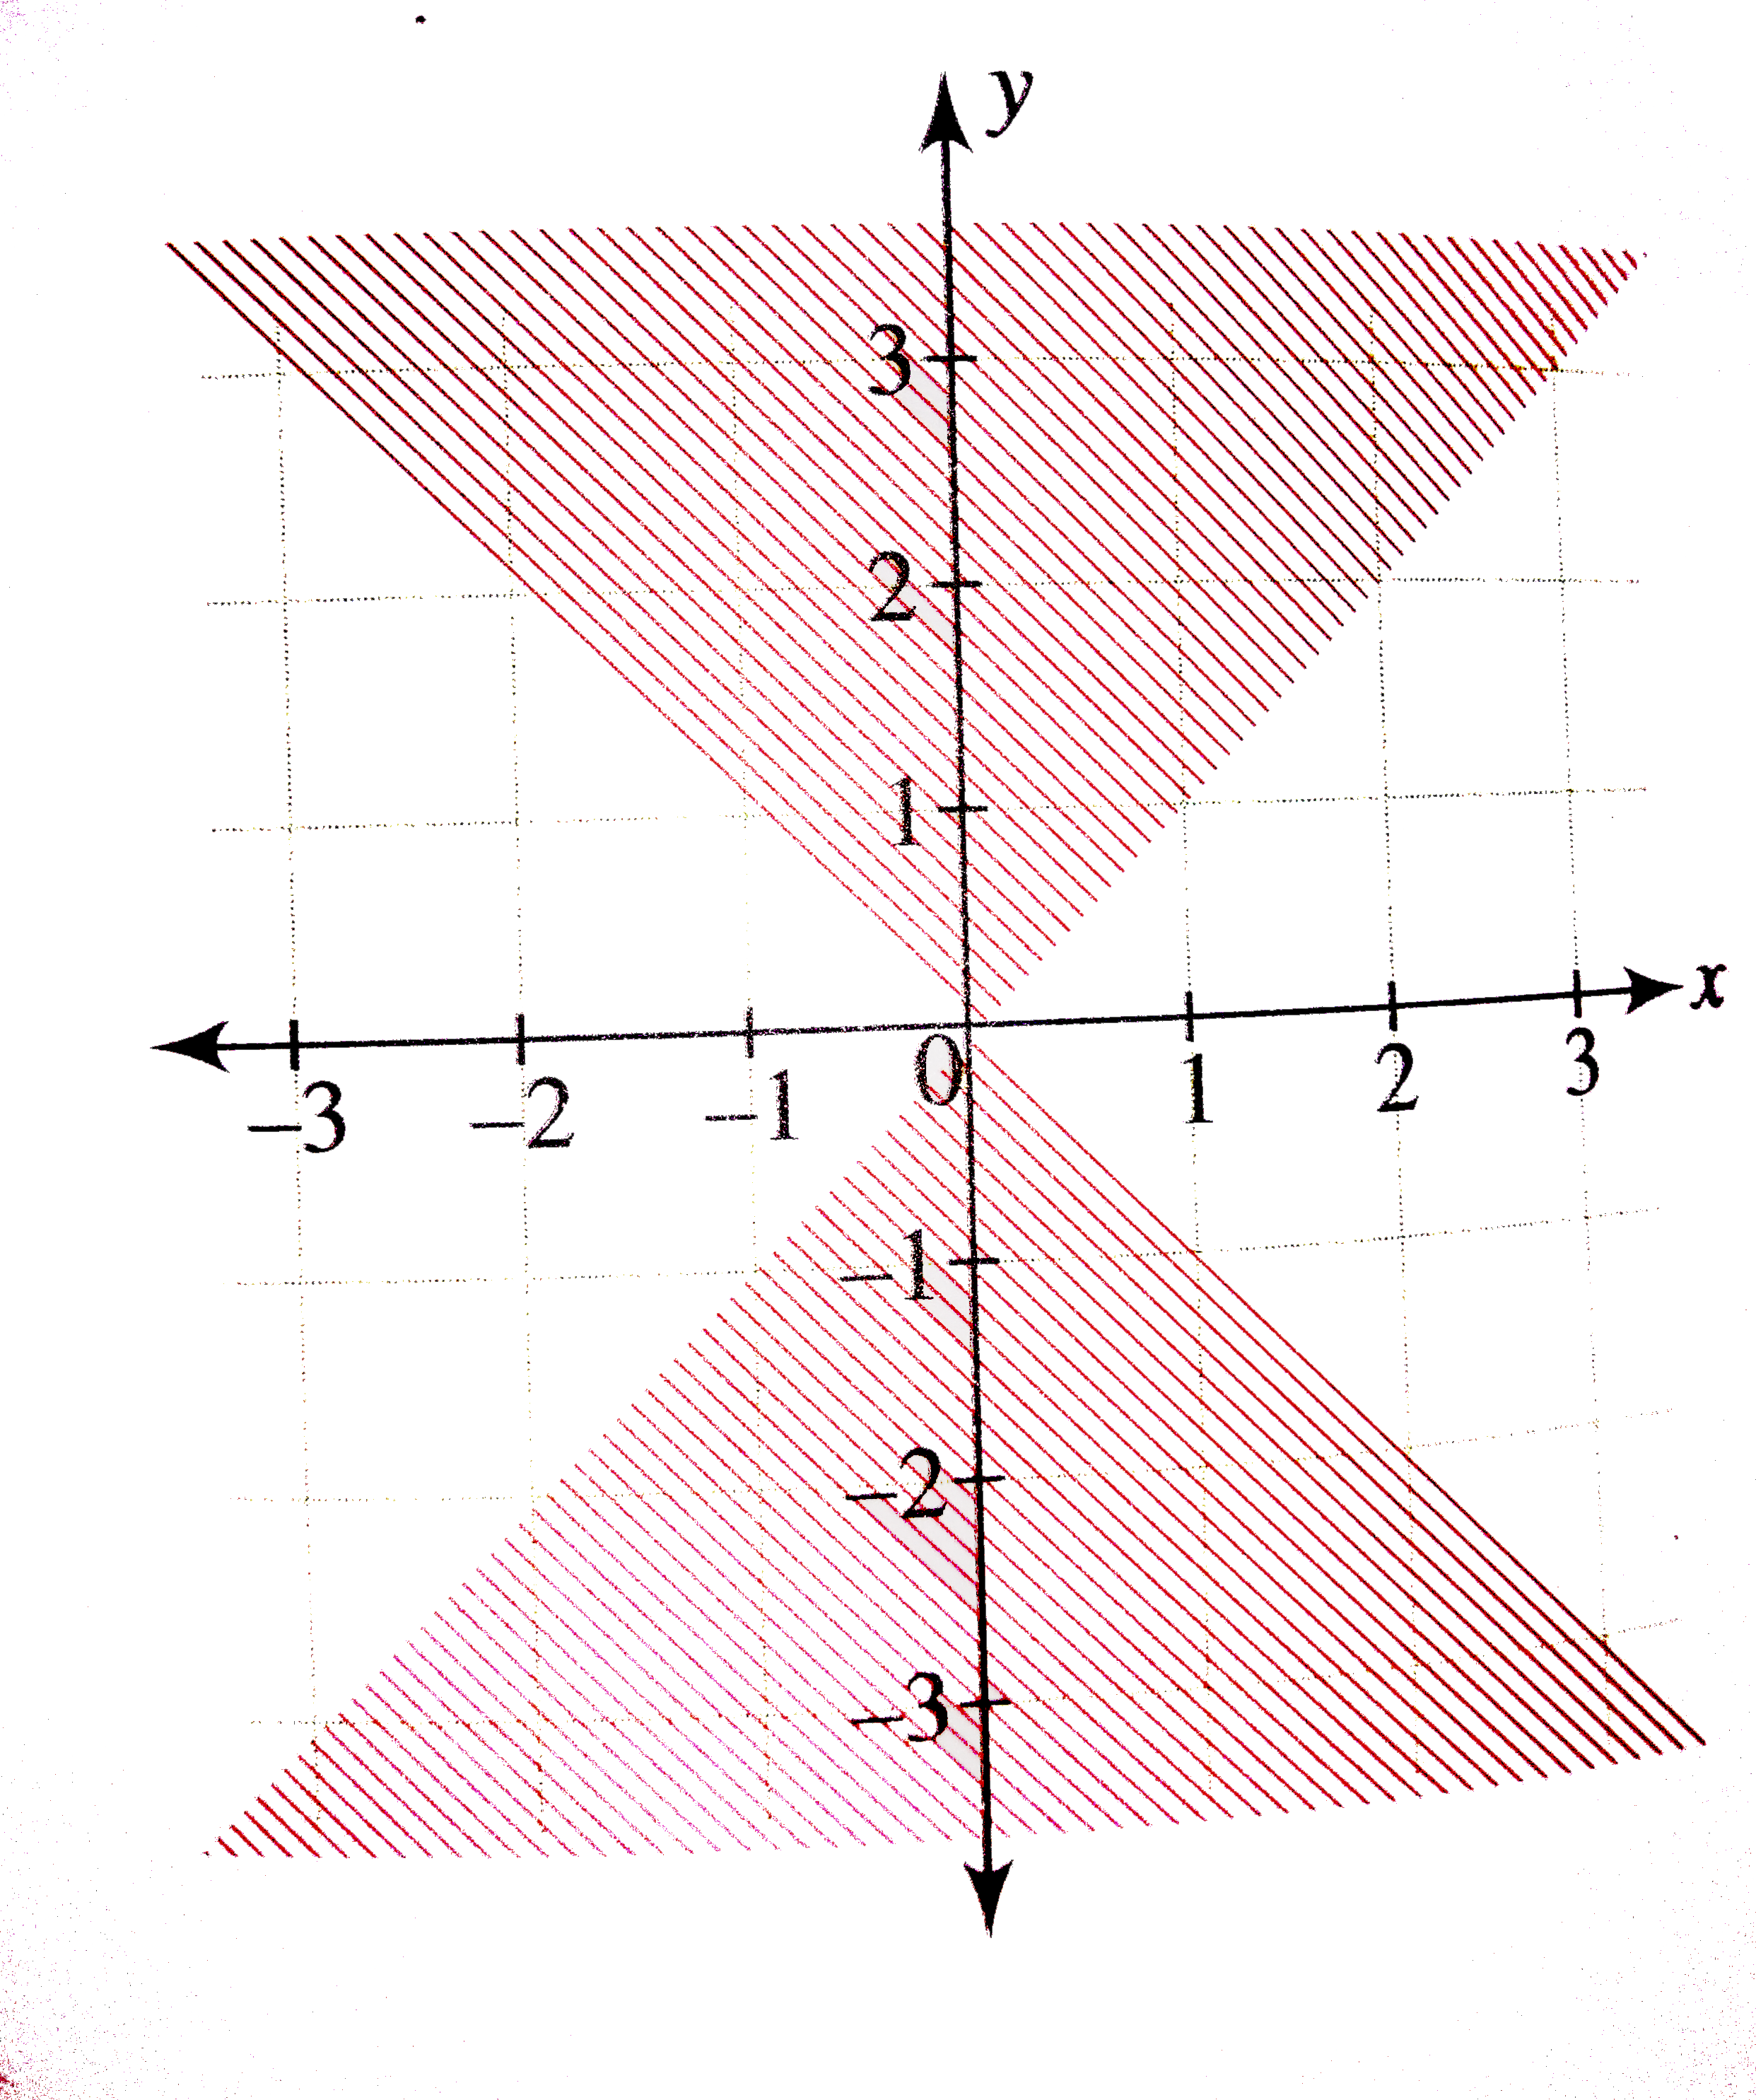
- Sketch the region satisfying |x| lt |y|.
Text Solution
|
- For a point P in the plane, let d1(P)a n dd2(P) be the distances of th...
Text Solution
|
- Draw the graph of y= (x-1)/(x-2).
Text Solution
|
- The following figure shows the graph of f(x) =ax^(2)+bx +c, then find ...
Text Solution
|
- The entire graph of the equation y=x^2+k x-x+9 in strictly above the x...
Text Solution
|
- If x^2+2a x+a<0AAx in [1,2], the find the values of adot
Text Solution
|
- Draw the graph of f(x) = x|x|.
Text Solution
|
- Draw the graph of the function: Solve |(x^2)/(x-1)|lt=1 using the grap...
Text Solution
|
- Draw the graph of y = |x^(2) - 2x|-x.
Text Solution
|
- Draw the graph of y = {{:(2^(x)",",, x^(2)-2x le 0 ),( 1+3.5 x- x^(2),...
Text Solution
|
- Draw the graph of f(x) = |x-1|+ |2x-3|. Find the range of the functio...
Text Solution
|
- Draw the graph of y= |x-1|+3|x-2|-5|x-4| and find the values of lamda ...
Text Solution
|
- Find the set of real value(s) of a for which the equation |2x+3|+2x-3|...
Text Solution
|
- Draw the graph of y= 2^(((|x|+x))/(x)).
Text Solution
|
- Draw the graph of y= x ^((1)/(log(e)x)).
Text Solution
|
- Find the number of solutions to the question x+log(e)x=0.
Text Solution
|
- draw the graph of f(x)=x+[x], [.] denotes greatest integer function.
Text Solution
|
- Given f(x) is a periodic function with period 2 and it is defined as ...
Text Solution
|