


Similar Questions
Explore conceptually related problems
Recommended Questions
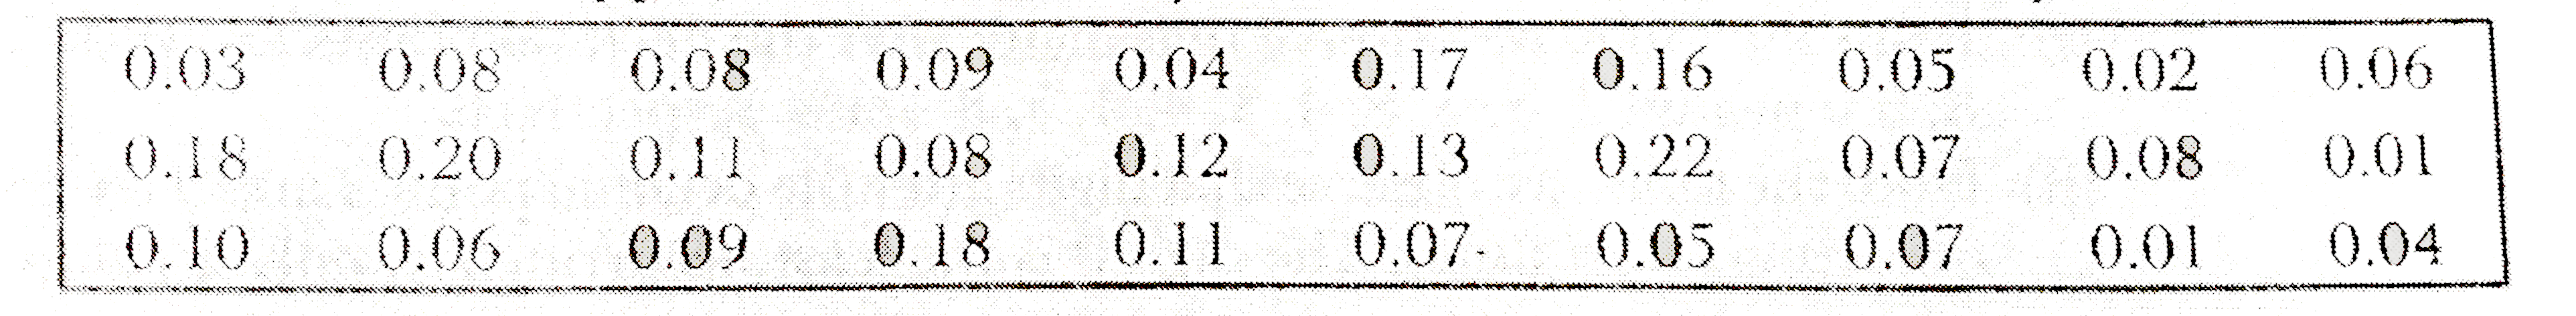
- A study was conducted to find out the concentration of sulphur dioxide...
Text Solution
|
- A study was conducted to find out the concentration of sulphur dioxid...
Text Solution
|
- A study was conduced to find out the concentration of sulphur dioxide ...
Text Solution
|
- A study was conducted to find out the concentration of sulphur dioxide...
Text Solution
|
- एक नगर में वायु में सल्फर डाई- ऑक्साइड का सांद्रण भाग प्रति मिलियन [pa...
Text Solution
|
- एक नागर में वायु में सल्फर डाई-ऑक्सीसडे का सांद्रण भाग प्रति मिलियन [p...
Text Solution
|
- एक नगर में वायु में सल्फर डाइऑक्साइड का सांद्रण भाग प्रति मिलियन में ज...
Text Solution
|
- A study was conducted to find out the concentration of sulphur dioxide...
Text Solution
|
- A study was conducted to find out the concentration of sulphur dioxide...
Text Solution
|