


Similar Questions
Explore conceptually related problems
Recommended Questions
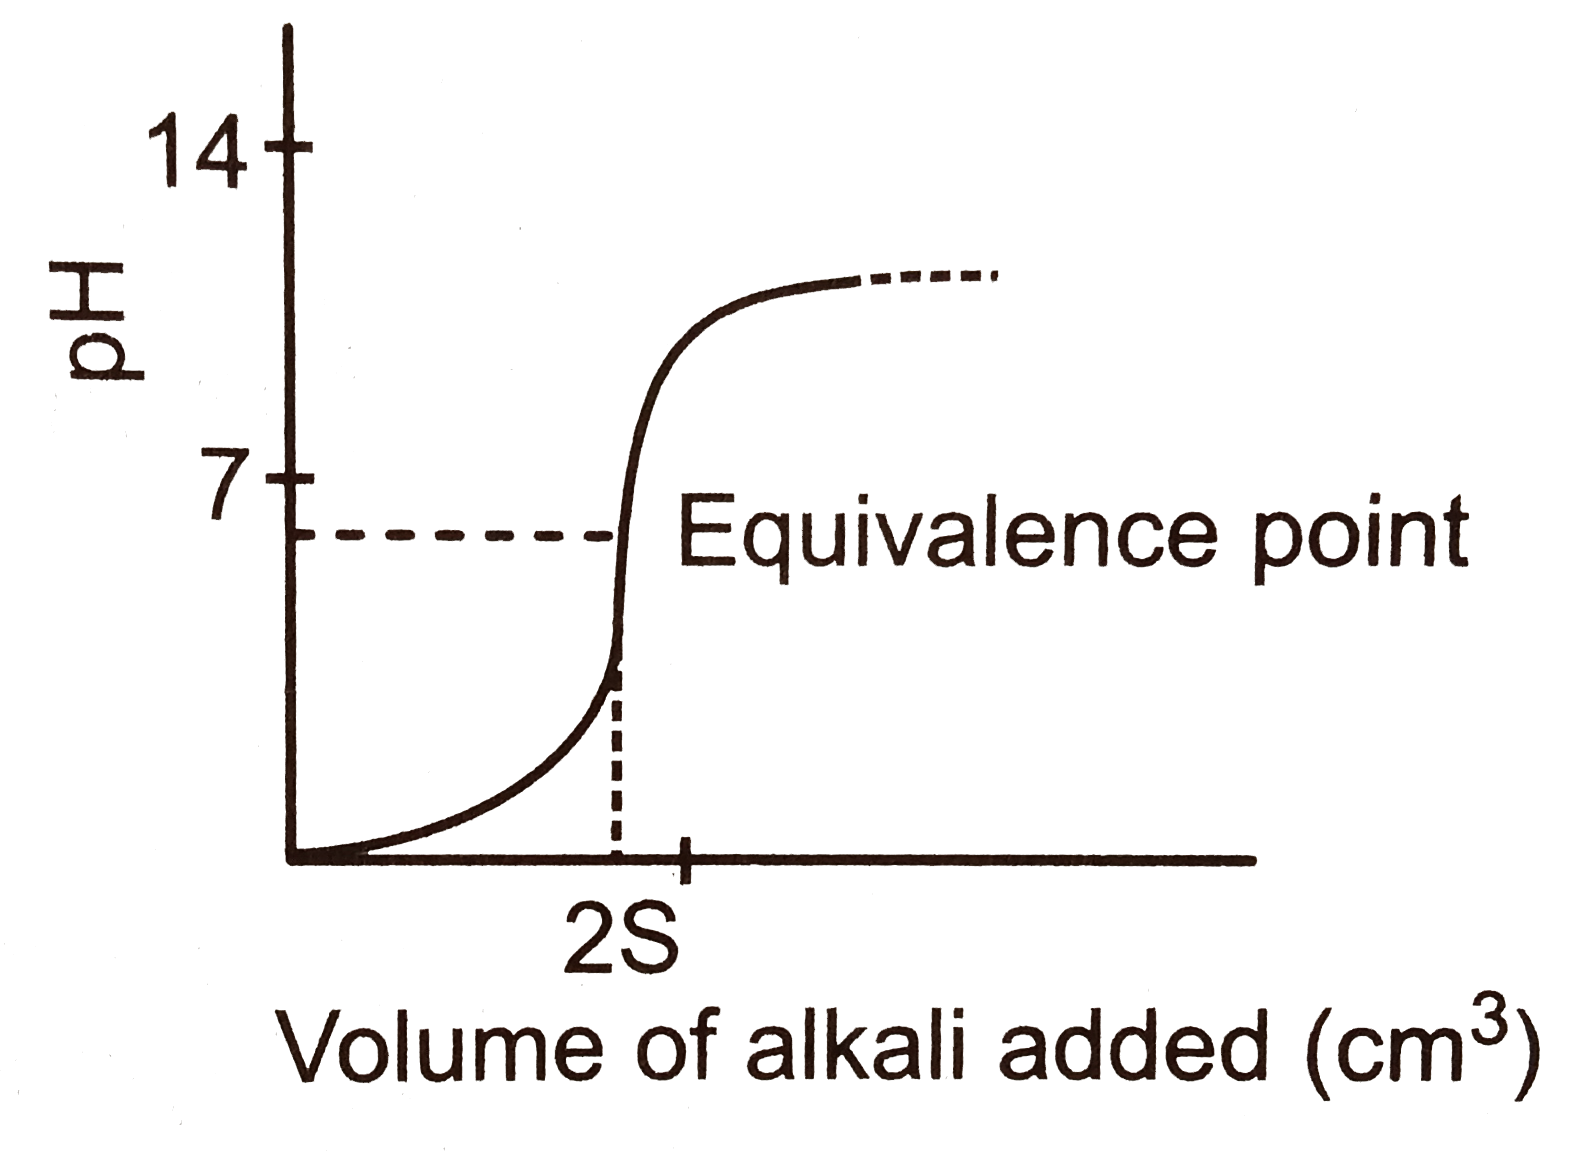
- The graph represents the titration curve for :
Text Solution
|
- The following graph represents the titration of pH vs volume
Text Solution
|
- The oscillations represented by curve 1 in the graph are expressed by ...
Text Solution
|
- The graph represents the titration curve for :
Text Solution
|
- In the given curve total area under the graph represents:
Text Solution
|
- The curve represents the titration of :
Text Solution
|
- The osciallations represented by curve 1 in the graph are expressed by...
Text Solution
|
- Which one of the following curves represents the graph pH during the t...
Text Solution
|
- which one of the following curves represents the graph of pH dur...
Text Solution
|