


Similar Questions
Explore conceptually related problems
Recommended Questions
- The velocity-time plot is shown in figure. Find the average speed in t...
Text Solution
|
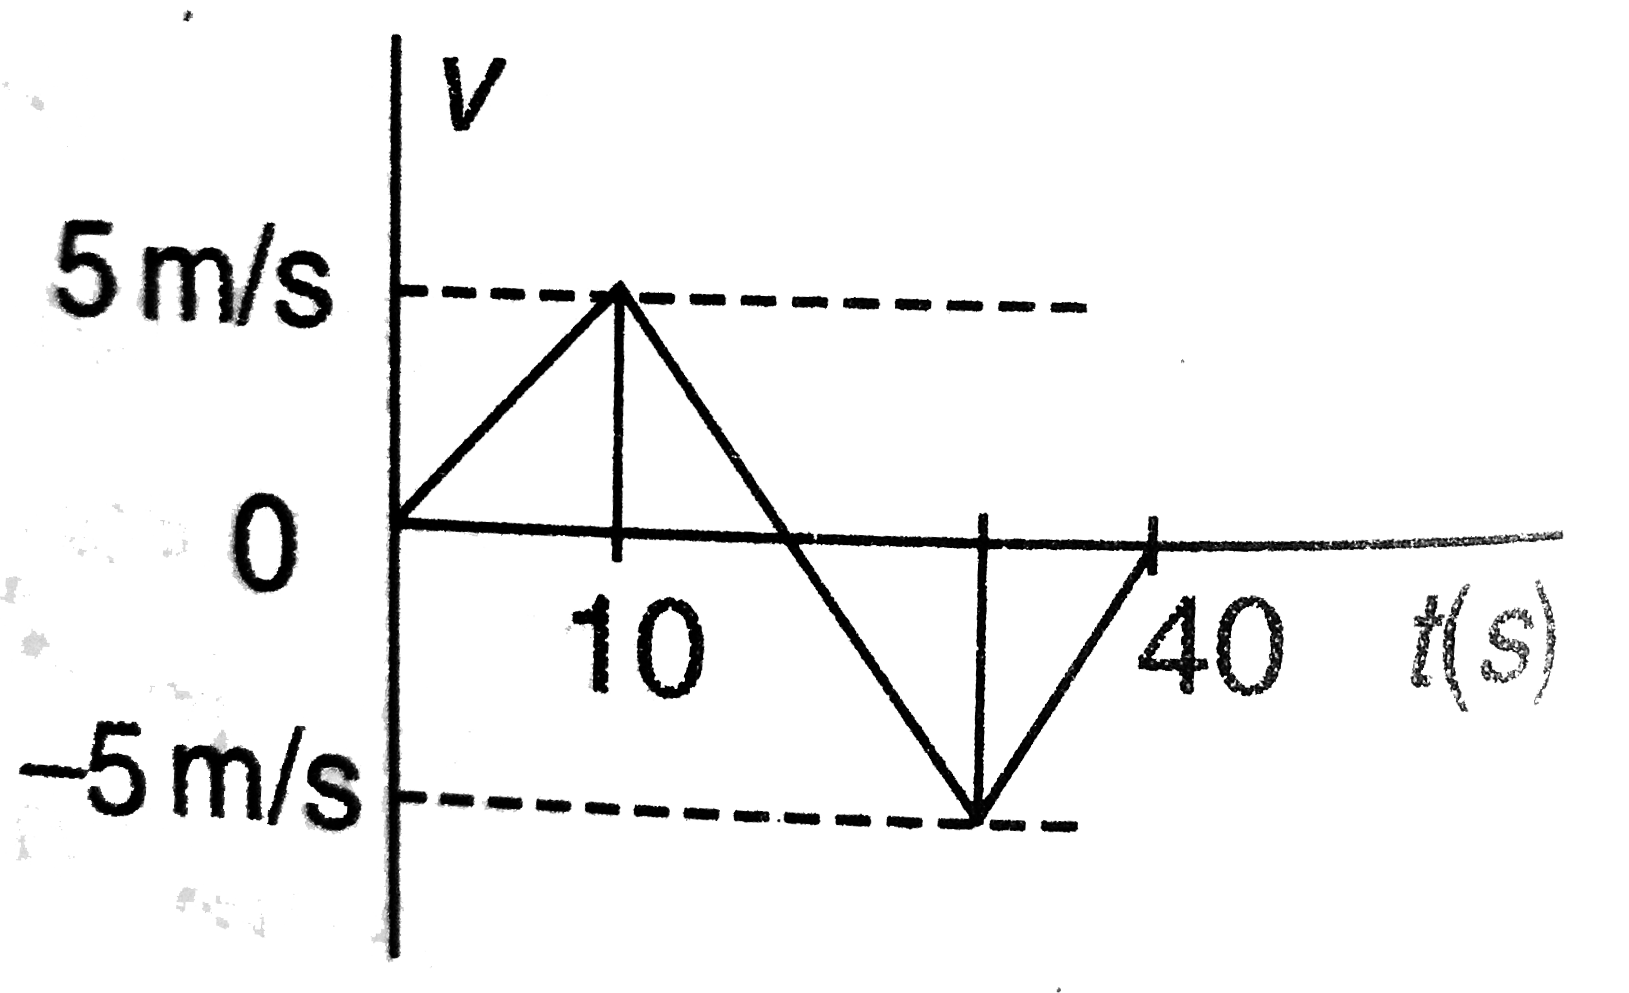
- From the velocity time plot shown in figure find the distance travelle...
Text Solution
|
- Figure shows x-t graph of a particle. Find the Time T Such that the Av...
Text Solution
|
- A particle is moving in a circle of radius 4 cm with constant speed of...
Text Solution
|
- From the velocity-time plot shown in Fig. find the distance travelled ...
Text Solution
|
- Velocity-time graph of a particle moving in a straight line is shown i...
Text Solution
|
- The velocity-time plot is shown in figure. Find the average speed in t...
Text Solution
|
- The velocity-time graph of a body is given below. Find the average vel...
Text Solution
|
- The position of a particle varies with time according to the relation ...
Text Solution
|