


Similar Questions
Explore conceptually related problems
Recommended Questions
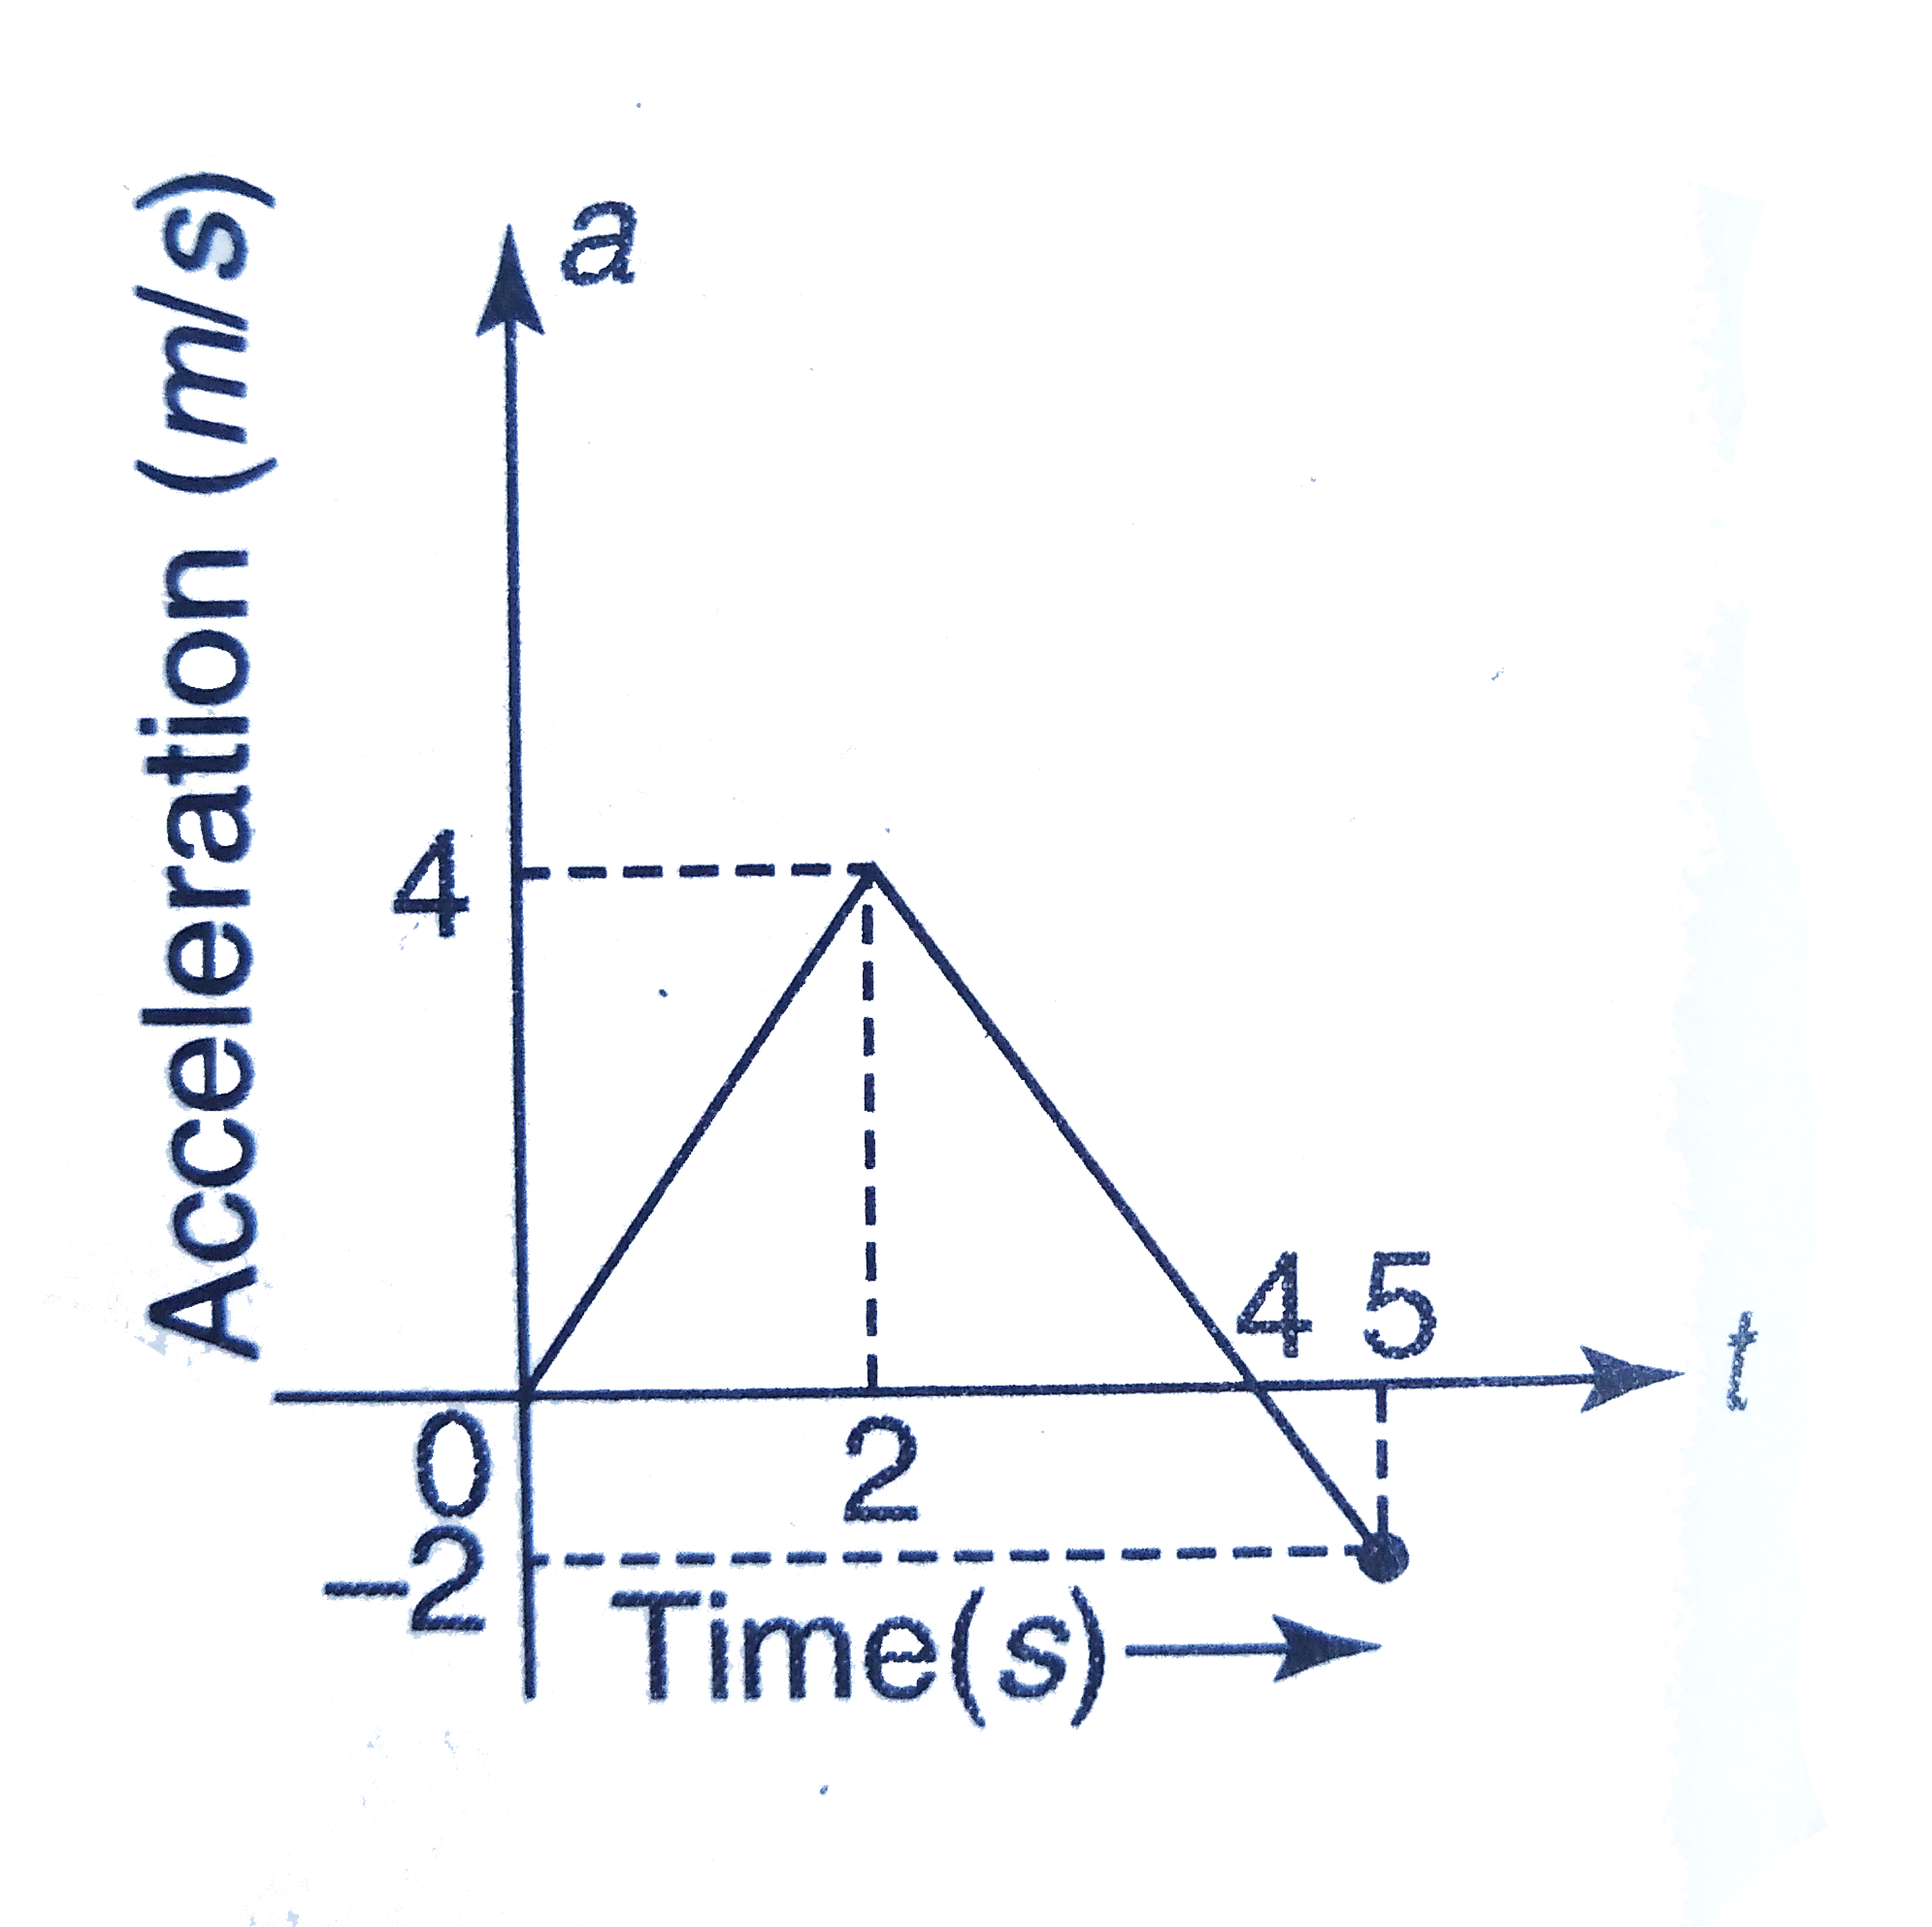
- Figure shows the graph of acceleration of particle as a function of ti...
Text Solution
|
- The acceleration of a particle starting from rest and travelling along...
Text Solution
|
- A particle starting from rest. Its acceleration (a) versus time (t) is...
Text Solution
|
- Figure shows the graph of acceleration of particle as a function of ti...
Text Solution
|
- A particle starts from rest and undergoes an acceleration as shown in ...
Text Solution
|
- A particle starts moving from rest in a from rest in a straight line. ...
Text Solution
|
- A particle starts moving from rest on a straight line. Its acceleratio...
Text Solution
|
- एक कण विरामावस्था से चलना प्रारम्भ करता है । इसका त्वरण (a) , समय (t)...
Text Solution
|
- A graph of acceleration versus time of a particle starting from rest a...
Text Solution
|