


Similar Questions
Explore conceptually related problems
Recommended Questions
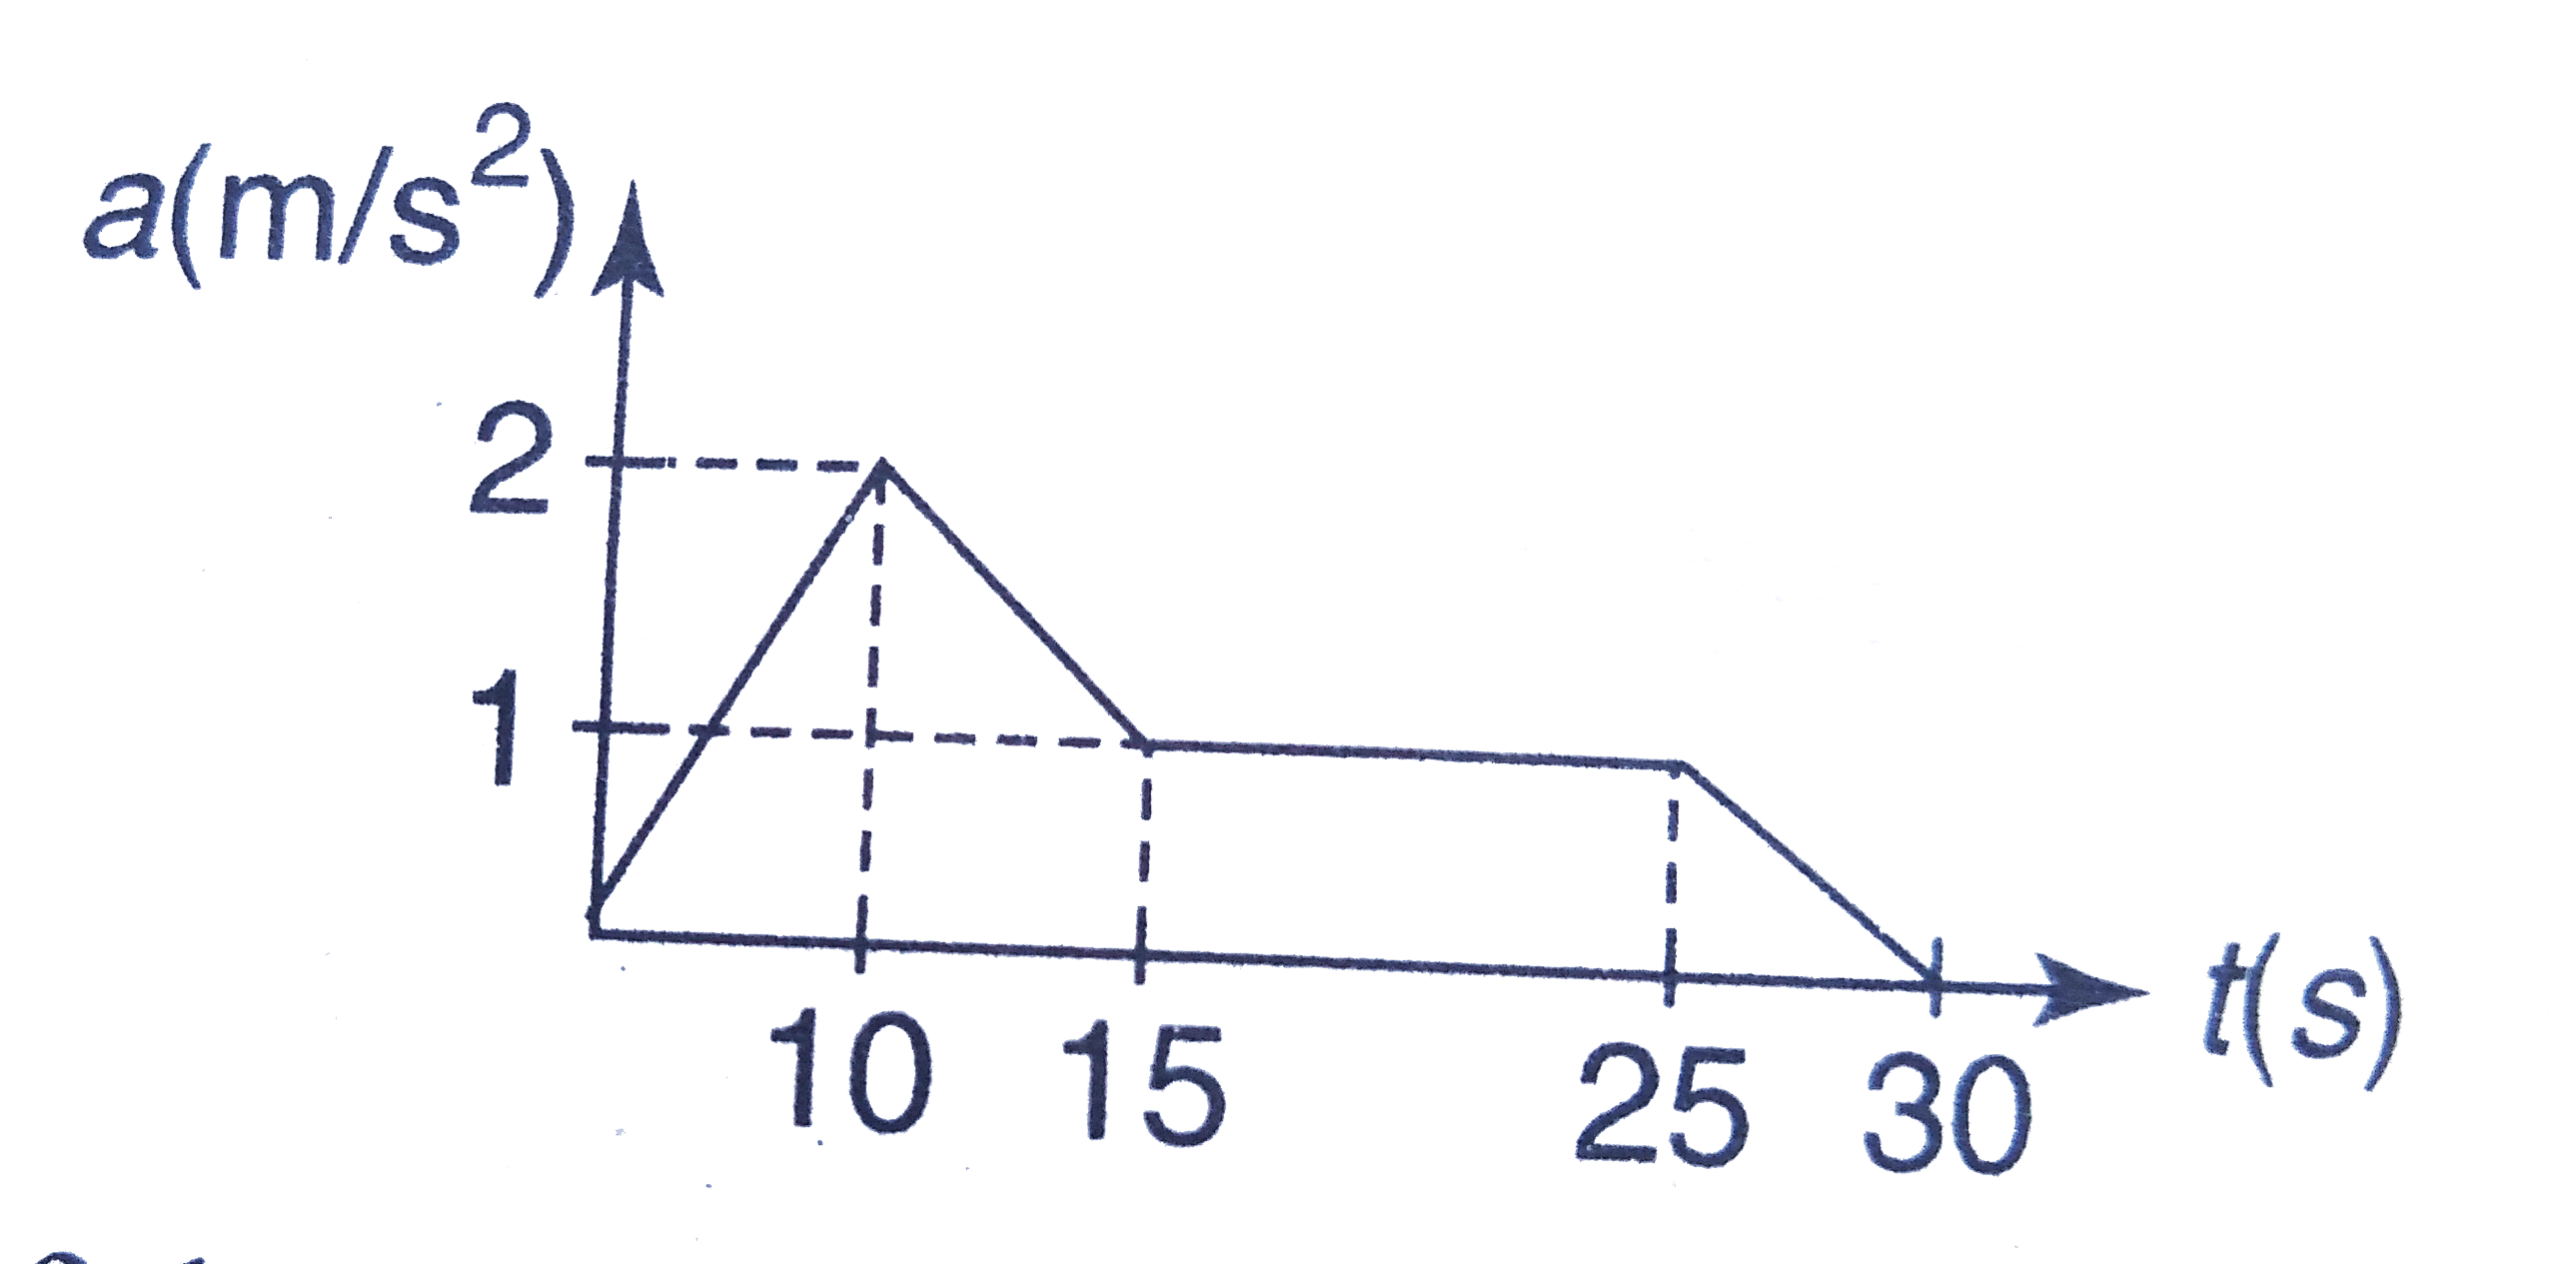
- In figure shown, the graph shows the variation of acceleration of body...
Text Solution
|
- A body starts from rest at time t = 0 , the acceleration time graph is...
Text Solution
|
- In figure shown, the graph shows the variation of acceleration of body...
Text Solution
|
- A body is performing simple harmonic motion with amplitude A and time ...
Text Solution
|
- Figure shows the displacement tiime (x-t) graph of a body moving in a ...
Text Solution
|
- The dependence of the acceleration of a body with time is shown in Fig...
Text Solution
|
- A body is performing simple harmonic motion of amplitude A and time pe...
Text Solution
|
- The graph in figure shows the velocity v versus time t for a body. Whi...
Text Solution
|
- 2kg द्रव्यमान के किसी पिंड का स्थिति समय ग्राफ चित्र में दर्शाया गया ह...
Text Solution
|