


Similar Questions
Explore conceptually related problems
Recommended Questions
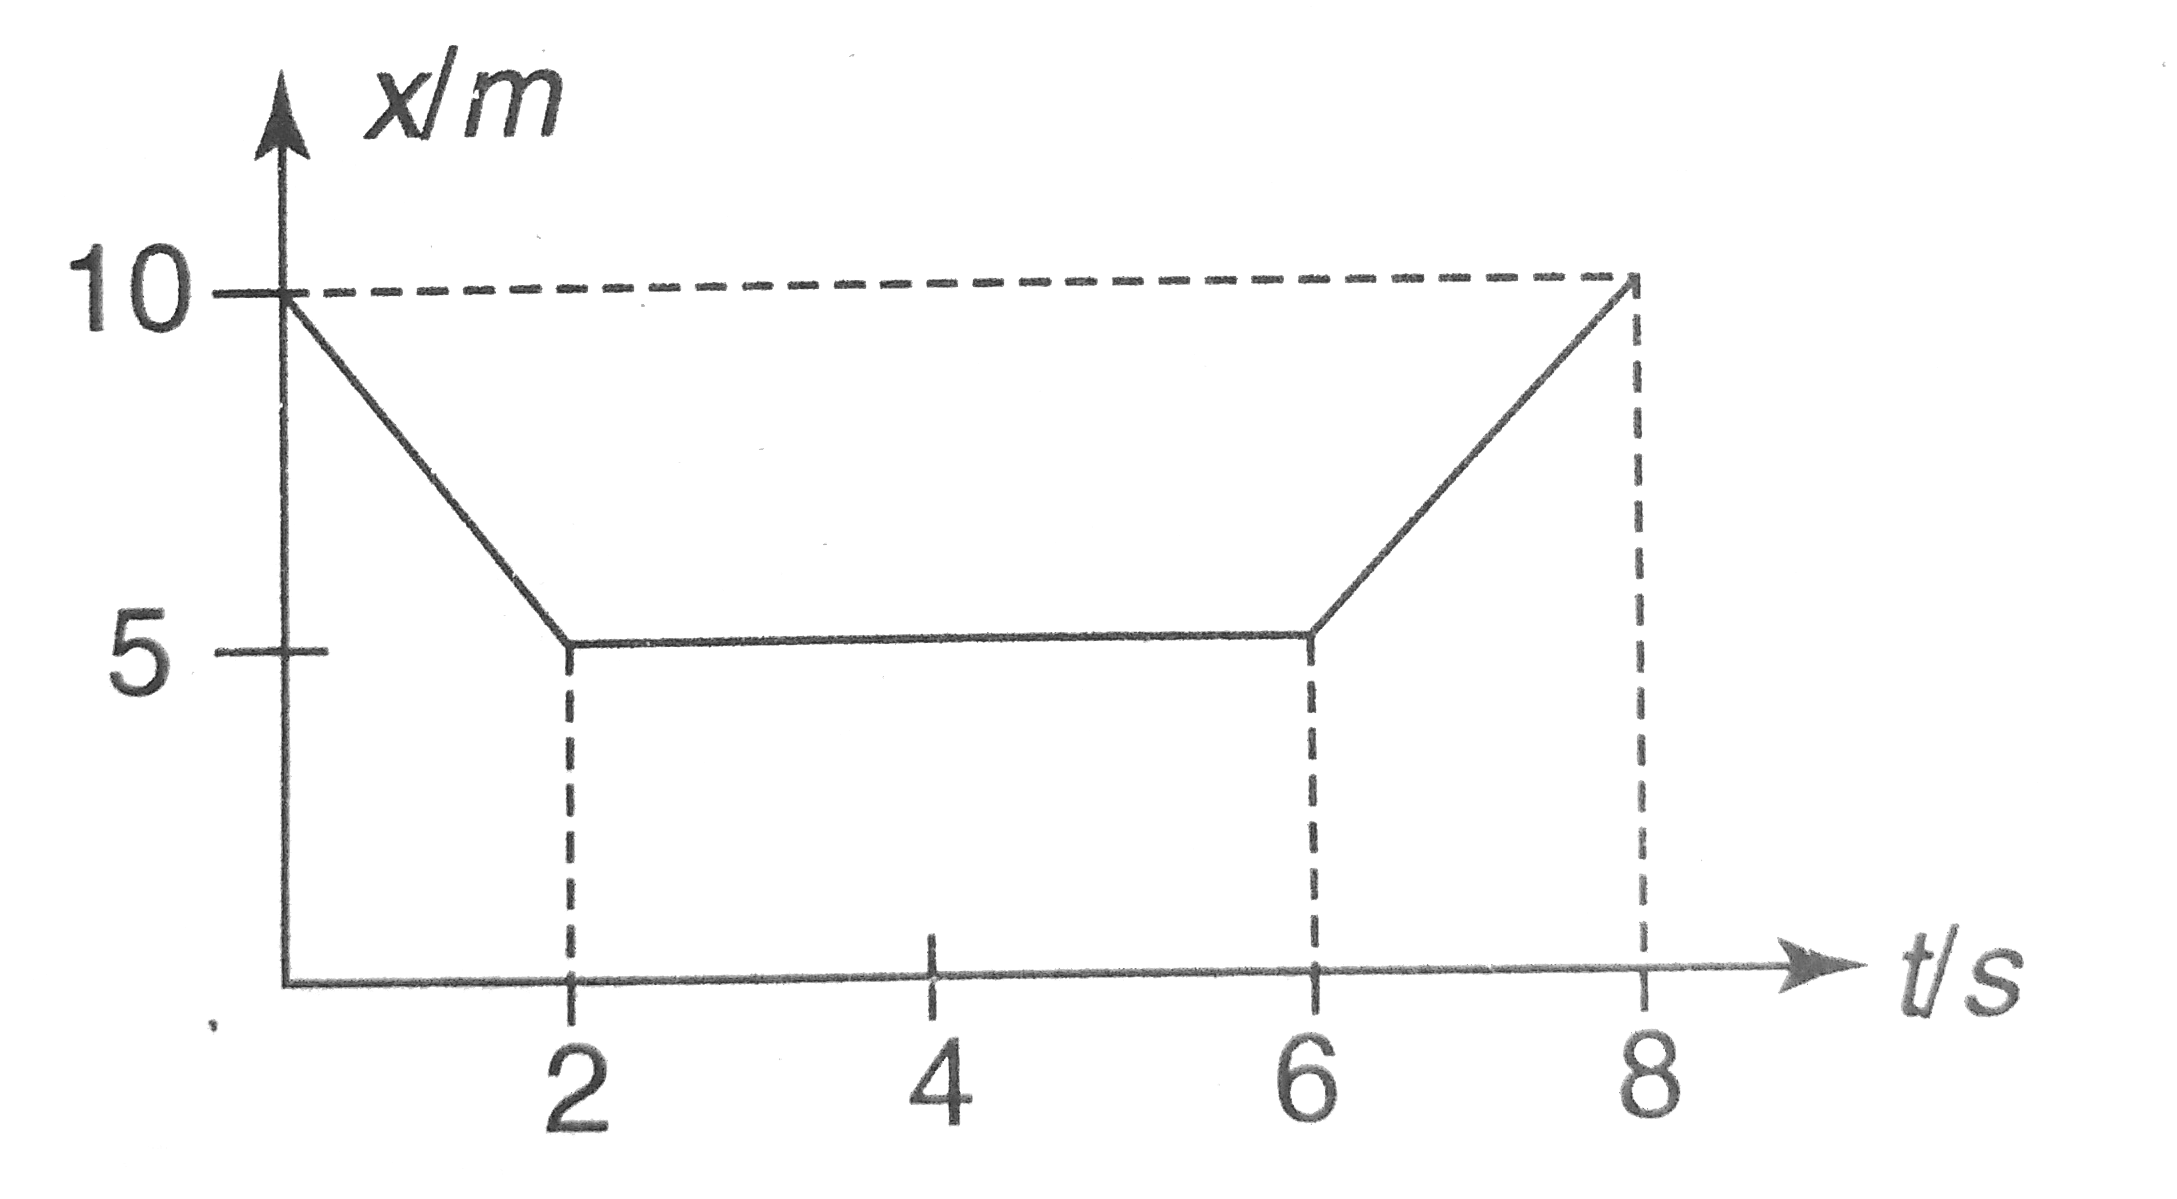
- Figure shows the position time graph for a particle in one dimensional...
Text Solution
|
- Figure shows the position the graph for a particle in one dimensional ...
Text Solution
|
- Figure shows the position time graph for a particle in one dimensional...
Text Solution
|
- The figure shows graph between velocity 'V' and displacement 'X' from ...
Text Solution
|
- Velocity time graph for a particle moving in a line is given. Calcul...
Text Solution
|
- Figure below shows the velocity-time graph of a one dimensional motion...
Text Solution
|
- The displacement-time graph of a particle executing simple harmonic mo...
Text Solution
|
- Figure shows the position-time graph of a particle moving on the X--ax...
Text Solution
|
- The displacement of a particle that performs one-dimensional motion wi...
Text Solution
|